Visualized Education

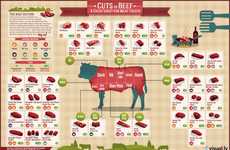
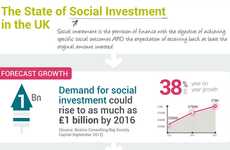
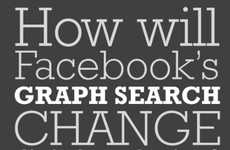
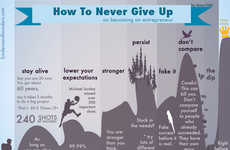
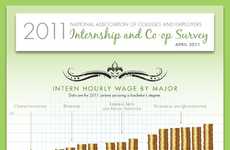
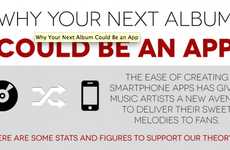
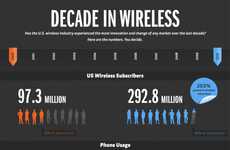
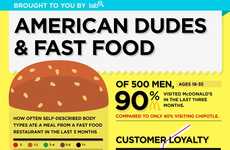
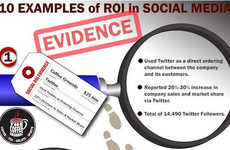
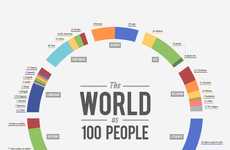
Infographics provide data in a design-conscious way

Implications - The age of instant gratification calls for all information to be presented in an attractive way. This concept is taken to new heights with design-conscious data visualization circulating online. This caters to consumers' need for extra stimulation while also acknowledging a more visual-based learning style, opening doors for consumers to receive information faster and more effectively.

Trend Themes

  1. Data Visualization — The use of infographics and visual representation of data has become a trend in conveying information more effectively and appealingly.
  2. Objective Statistics — The use of objective, fact-based statistics has become a trend in making important information more digestible and easily understood.
  3. Social Media Branding — Companies harnessing the power of social media for effective branding and marketing is a current trend in the industry.

Industry Implications

  1. Marketing — The use of data visualization and social media branding offer a disruptive innovation opportunity for businesses to capture and engage wider audience through more effective and appealing marketing strategies.
  2. Publishing and Media — Objective statistics in the form of infographics and charts offer an opportunity for publishers and media companies to present relevant information to their audience in a more engaging and visually appealing way.
  3. Education — The trend in using data visualization as a way of presenting information can be adopted in education to make learning more stimulating and effective for visual-based learners.
4.9
Score
Popularity
Activity
Freshness
Patterns
Megatrends
10 Featured, 84 Examples:
403,339 Total Clicks
Date Range:
Feb 13 — May 13
Trending:
Warm
Consumer Insight Topics:

Featured Examples

Social Branding Success Charts
This Infographic Explores the Best Brand ROI Through Social Media
In this world of extensive social media branding and marketing, it can be hard for companies to see a significant return on investment (ROI) with so much information going back and forth over social... MORE
Fashion Forward City Infographics
This Chart Determines the Best Dressed Cities in the U.S.
This infographic takes a look at the best dressed cities in the United States in an effort to settle the debate once and for all. Every city has their own style preferences and taste-making... MORE
Scaled-Down Population Infographics
'The World as 100 People' Chart Gives a Snapshot of Human Life
The population on Earth continues to go higher with every passing year and ‘The World as 100 People’ infographic helps to put the various characteristics about human life on our little... MORE
Frugal-Minded Aussie Infographics
This Chart Details Australian Saving Habits
This infographic looks at the saving habits of Australians and reveals some positive indicators for the country down under. With the uncertain global economy, debt is becoming more and more of a... MORE
Terrifying Online Tracking Infographics
This Chart Reminds Us That All Online Activity is Tracked
It can be easy to forget that with how much we do on the Internet everything we do can be watched and cataloged; online tracking is a very real thing and it can affect any user. Everything someone... MORE
Informative Meat Eater Infographics
The Visual.ly Cuts of Beef Chart Breaks Down Cuts of Chuck
The Visual.ly Cuts of Beef infographic displays where it is exactly that various slices of chuck are taken from. As the cow is a large animal, edibles are sourced from various sections of the animal,... MORE
Annual Tech Breakthrough Infographics
This Chart Breaks Down 2012's Top Engineering Achievements
Aside from the general statements made about technology these days, it’s nice to look specifically at the top engineering achievements of the year. With an infographic like this, it makes it... MORE
Social Investment Infographics
ClearlySo Marks the Start of the Future for Children Bond
ClearlySo is often a place social entrepreneurs and investors go to find up-to-date information of what’s going on in the social business and social enterprise worlds so it’s no surprise... MORE
Objective Legalization Stats
The Infographic Objectively Showcases America's Stance on Marijuana
This infographic offers different and objective marijuana use statistics that showcase the diverse perspective stances on the subject in the United States. The nation has slowly but surely been... MORE
Negative Nicotine Effects Infographics
This Chart Explores the Effect of Nicotine on Your Body
Most people who smoke cigarettes know they contain all kinds of chemicals, but what exactly is the effect of nicotine specifically on your body? This infographic gets scientific and breaks down the... MORE

Related Examples

Baby Gift Recommendation Services
NeverMissGift Offers Suggestions on Gifts for Friend's Kids
Spacious City Getaways
Thomas Griem's Penthouse Apartment Brings a Country Feel into the City
Cartilage-Attached Kicks
These Bone High Heels Have Robbed Skeletons of Their Bits
Profit-Based Coffee Charts
This Chart Lays Out the Profit Plan for Global Coffee Business
play_circle_filledAuto-Infused Whisky Packaging
Auto-Infused Whisky Packaging
Booze and Cars Merge for Chivas 18 by Pininfarina Limited Editions
First Date Navigation Charts
Alex Cornell's Dating Infographic Sorts Out Romantic Destinations
Unorthodox Gun Control Ads
The 'Mother's Demand Action' Group Compares the Danger of Books to Guns
Bystander Bullying Advice Charts
Discover Ways to Stop Street Harassment in This Infographic
Safe Bike Route Apps
Ride the City Finds the Shortest and Safest Routes for Cyclists
play_circle_filledTeenage Social Media Charts
Teenage Social Media Charts
This Infographic Explores the Relationships Between Teens and Facebook
Immense Population Charts
7 Billion World Color Codes Every Person on Earth by Continent
Integrated Measuring Cutting Boards
This Concept Cutting Board Really Measures Up
Perfecting Resume Guides
This Infographic Gives Great Tips for Crafting the Perfect Resume
Exploratory Infographic Charts
This Infographic Explores Various Kinds of Info Charts
Fuel Addiction Infographics
America's Addiction to Oil is Revealing
Online Security Mistake Charts
Symantic's Infographic Shows the Five Biggest Web Security Mistakes
Instructional Social Media Guides
This Infographic Teaches Key Shortcuts and Google+ Tricks
Excessively Towering Onion Burgers
A Burger King Fan Makes and Eats Onion Burger with 100 Layers
Nerdy Romance Infographics
The Geek Love Infographic Looks at Sci-Fi Love Over the Years
Email Hacker Infographics
Find Out Just How Many People Fall Prey to Phishing Scams
Internet Lingo Infographics
This 'Twictionary' Helps Keep Ever-Evolving Twitter Lingo in Check
Internet Addiction Infographics
This Infographic Poses Tough Questions About Extreme Internet Use
Evolutionary Search Engine Infographics
Monetate Explores the 20 Year History of Web Searching
Whisky-Wafting Infographics
This Chart Details the Many Flavors of Whiskey
Trillion-Dollar Company Infographics
This Chart Outlines Apple's Path to Being Worth $1 Trillion
Online Billionaire Startup Infographics
Staff Lays Out the Numbers For the Biggest Online Startups
Cult-Crazed Fan Infographics
This Chart Compares Cult Followings From a Variety of Angles
College Connectivity Infographics
This Chart Explores College WiFi and Its Importance to Students
Anti-Government Rebel Infographics
This Government Infographic is All About Justice
Tech Investment Infographics
Should You Invest in Tech IPO's Asks the Tough Questions
Cyber Criminal Profile Infographics
This Chart Explains How Online Criminals Operate
Crafty Eco Clothing Infographics
This Chart Explains Eco Fashion and Where it Comes From
Tourism Domination Infographics
This Chart Explores the Massive Dubai Tourism Industry
Ridiculously Enormous Stacked Burgers
The Triple Triple is One of the World's Biggest Hamburgers
Child-Saving Decor Infographics
This Child Safety Guide Takes Things Room by Room
Creative Subconscious Control Infographics
This Infographic Explains REM and Dream Control
Stressful Gadget Love Infographics
This Infographic Compares Romantic and Gadget Stress
Cheese-Choosing Infographics
This Chart Details the Differing Flavors of Cheese
Suave Dating Tip Infographics
GroomU Gives Essential Advice on Dating for Gentlemen
play_circle_filledRomance Reality Video Infographics
Romance Reality Video Infographics
This Infographic Explains Valentine's Day History in Detail
Cheeky Resume Infographics
TopCounsellingSchools.org Approaches Resume Help in a Humorous Way
Love-Induced Shopping Charts
This Valentine's Day Infographic Details Shopping Figures
Life Guiding Infographics
Grant Snyder Shows How to Follow Dreams in This Valuable Life Comic
Proper Interview Etiquette Infographics
Best Interview Practices are Essential to Getting the Job
Social Media Marketing Infographics
How the Facebook Graph Search Tool Will Impact Online Ads
Inspiring Entrepreneur Infographics
This Chart Will Motivate You to Start Your Own Business
Lucrative Idea Infographics
Grow America Shows That Billion Dollar Ideas Can be Simple Ones
Economy-Influencing Sports Charts
This Infographic Details the Super Bowl's Economic Impact
Internship-Deciding Infographics
This Infographic Breaks Down the Internship Decision
Peculiar Burger-Based Pies
The Deep Dish Cheeseburger Pie is for Meat-Loving Pie Enthusiasts
Healthcare-Clarifying Charts
Understand Obama's 11-Year Plan with 'What the Health?'
Hollywood Hustling Infographics
Allmand Law Reveals How Cinemas Evade High Costs in Movie Making
Millionaire Beef Infographics
The Phrase Donald Trump for President Had a Lot of People Talking
Marketing Secrets Infographics
Infographic Delves into the Depths Consumer Psychology
Image Sharing Impact Infographics
Sharing Photos on Social Networks Has Become the Norm
Album-Delivering Apps
Will Music Artist Apps Be the Next Music Delivery Channel?
Internet Study Buddies
This Infographic Looks at Gen-Y Student Work Patterns
play_circle_filledEnlarged Pictogram Architecture
Enlarged Pictogram Architecture
The Design of the Little Factory was Inspired by a Cartoon Symbol
Costly Car-Care Confessions
This Infographic Reveals Car Ownership Patterns
Future Employment Indicator Infographics
This Chart Gives Job Info to Assist Children’s Care
play_circle_filledSleek Screen-Comparison Charts
Sleek Screen-Comparison Charts
This Video Infographic Compares Visual Specs for Apple Devices
Mobile Mania Measurements
This Chart Looks at a Decade in Wireless Usage in the United States
Federal Swear-In Schedules
This Infographic Details Obama's Inauguration Schedule
Exceptional Electronics Infographics
This Infographic Details Some CES 2013 Products
Technological Integration Infographics
This Chart Explores Technology in Chinese Education
Presidential Swear-Ins Infographics
In Tribute to the Presidential Inauguration 2013
Frequent Football Viewership Charts
Tributing the Upcoming 2012-2013 NFL Playoffs
Nerdy Hollywood Infographics
This Chart Details Your Fave Geek Celebrities and Their Nerdy Ways
Teenage Drug Use Infographics
This Chart Enables Parents to Identify When Their Teen Is Using
play_circle_filledMerry Marijuana-Infused Dinners
Merry Marijuana-Infused Dinners
Big Norm Cooks Up Nothing but Weed Food for His Dinner Party
Breakfast-Inspired Hamburgers
McDonald's Bagel Burgers Make a Limited Time Entrance in France
Tasty Hamburger Ear Warmers
The Burger Plush Earmuffs is a Winter Accessory for Food Lovers
Edible Beef Shooters
The Meat Shot Glasses by ManBQue is Made for Manly Carnivores
Deep Fried Italian Bites
The Manowar Burger Coats and Sautees Lasagna Dishes
Festive Squash Hamburgers
The Burger King Pumpkin Burger is Only Available in Japan
Marijuana-Smoke Artworks
Blow Job by Fernando de La Rocque is Sinfully Artistic
Cultural Street Eats Charts
The Latin Americans and Street Food Infographic is Flavor-Focused
Pot-Prediction Graphs
'The Economics of Not Legalizing Marijuana' Infographic is Revealing
Ironic Kitchen Aids
Ironic Kitchen Aids
The Pot Holder is Perfect for Stoner Chefs
Fast Food Figures
Fast Food Figures
The Lab American Dudes and Fast Food Infographic is Frightening and Enlightening
Ganja-Friendly Roomate Finders
420 Room Search Helps You Find Sticky Icky Room Rentals
Cannabis Caviar
Cannabis Caviar
This $1,400 an Ounce Marijuana Strain is a One-Hitter Quitter
play_circle_filledPot for Prosperity
Pot for Prosperity
Legalizing Marijuana to Bail Out California's State Government?
Stoned Advertisements
Showtime Promotes 'Weeds' With History of Cannabis