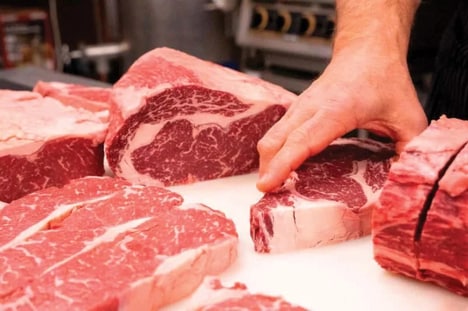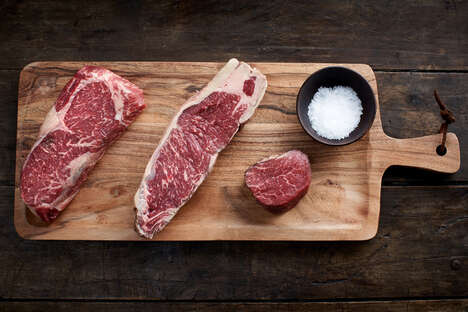
The Visual.ly Cuts of Beef infographic displays where it is exactly that various slices of chuck are taken from. As the cow is a large animal, edibles are sourced from various sections of the animal, each full of diverse flavor, texture and fat composites.
Listed alongside this visual breakdown of the cow are food preparation methods and an approximate price list. Interestingly, while the underlying source remains the same, costs and meals vary significantly, speaking to the importance and relevancy of cows. With references to ribs, short loins, rounds, sirloins, flanks and briskets, little is left out of this picture, organized here in an interactive manner with diagrams, arrows and detailed pictures featuring various food items.
What Makes This Trend Stand Out
- Meat Consumption Awareness
- Consumers are increasingly interested in knowing where their meat comes from and how it is prepared and priced, creating a demand for informative infographics such as the Visual.ly Cuts of Beef Chart.
- Interactive Food Education
- Interactive visuals and diagrams, such as those in the Visual.ly Cuts of Beef Chart, are becoming increasingly popular as a way to educate consumers on food sources and preparation methods.
- Transparency in Food Industry
- Infographics and visual representations, such as the Visual.ly Cuts of Beef Chart, are part of a growing trend towards transparency in the food industry, giving consumers more information about the food they are buying and consuming.
Sectors Adopting This
- Food Retail
- Food retailers can take advantage of the trend towards meat consumption awareness by offering informative infographics on their meat products to help consumers understand the cuts of meat and how they are priced and prepared.
- Agriculture
- Agriculture companies can use interactive visuals and diagrams to educate consumers on where their meat comes from and how it is produced, promoting transparency in the food industry and potentially increasing consumer trust.
- Marketing
- Marketing companies can create infographics and visual representations, similar to the Visual.ly Cuts of Beef Chart, to help clients in the food industry promote their products and educate consumers on where their food comes from and how it is produced.