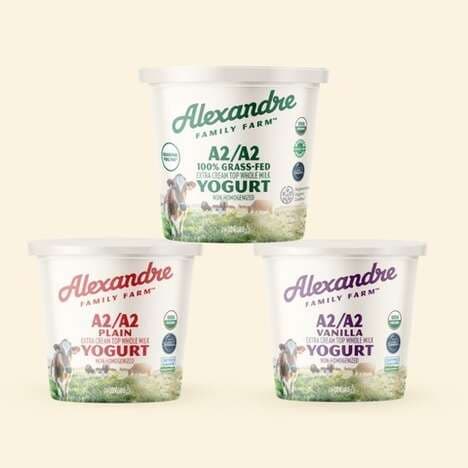
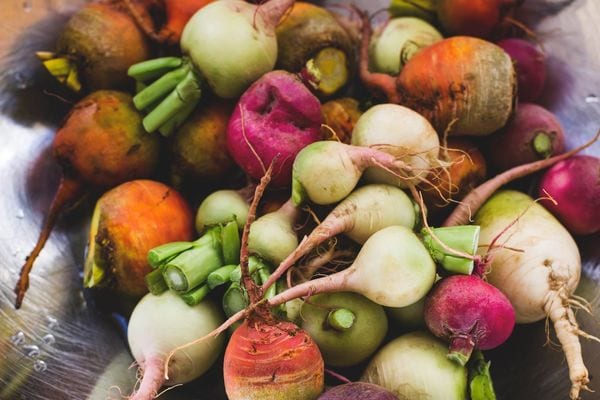
An interactive sourcing map allows you to see where your dairy comes from. Organic yogurt company Stonyfield created a supply chain map online, allowing you to click on an ingredient to find out more about the farmers who produced it.
The sourcing map not only gets customers involved, it also acts as a tool to engage internal stakeholders. The map shows most of Stonyfield's ingredient comes from within the United States. Although, some ingredients are imported from elsewhere, like sugar from Madagascar and sugar cane from Sao Paulo, Brazil.
This will likely appeal to a socially conscious consumer, interested in knowing where their food comes from. Given that the Stonyfield product is already organic, it also appeals to the health conscious.
What Makes This Trend Stand Out
- Transparency in Sourcing
- Creating interactive maps that showcase the origin of ingredients can offer transparency in sourcing and build trust with socially conscious consumers.
- Customer Engagement
- Utilizing interactive tools like sourcing maps can not only inform customers about a product's sourcing but also engage them in a meaningful way.
- Supply Chain Visibility
- Interactive sourcing maps provide a platform for businesses to showcase their supply chain and highlight their commitment to sustainability and responsible sourcing.
Sectors Adopting This
- Food and Beverage
- Interactive sourcing maps can be a valuable tool for food and beverage companies to showcase transparency in ingredient sourcing and build consumer trust.
- Retail
- Retailers can leverage interactive sourcing maps to educate and engage customers about the origins of products they sell, enhancing their brand reputation.
- Technology
- Companies in the technology industry can develop software solutions to create interactive sourcing maps for businesses across various sectors, enhancing supply chain visibility and fostering sustainable practices.