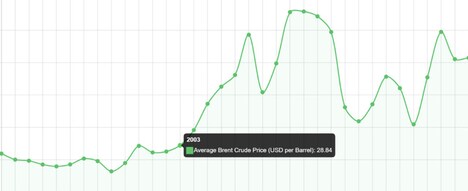
This typeface translates tiny charts in text without using code. Data design company After the Flood created a font called AtF Spark to address the problem of incorporating high-level data insights into feeds without Javascript by enabling people to communicate this sort of quantitative information on the web without coding.
Tiny charts in text (or sparklines) are a data visualization tool that increase understanding and the London-based studio want to make them more accessible with their numbers-transforming opentype font. AtF Sparkface turns a series of numbers into a graph in the middle of your sentence and works across a variety of web browsers, Adobe Illustrator, Microsoft Word and other platforms. You can download it for free from their website.
What Makes This Trend Stand Out
- Tiny Charts in Text
- Using tiny charts in text as a data visualization tool to increase understanding.
- Opentype Fonts
- Creating opentype fonts as a tool to address the problem of incorporating high-level data insights into feeds without javascript.
- Data Design
- Using data design as a tool to communicate quantitative information without coding.
Sectors Adopting This
- Graphic Design
- Innovative use of typography and data design to create new visualizations and communication tools.
- Web Design
- Creating custom fonts and incorporating data visualizations into websites.
- Data Analysis
- Developing new data visualization tools for analysis and communication of quantitative information.