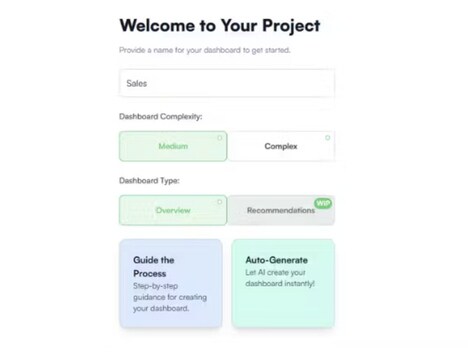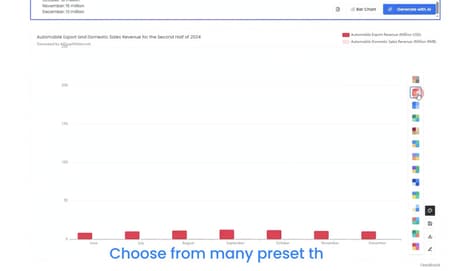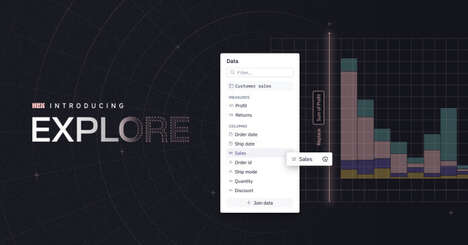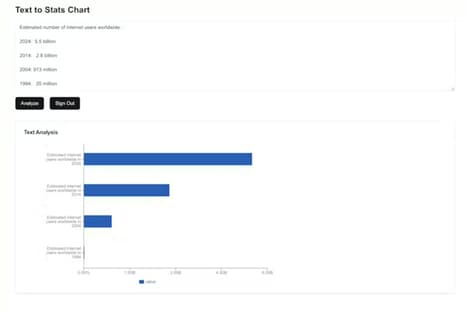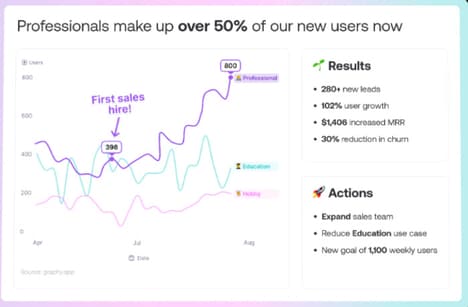

Data is the new raw material that drives whole economies, almost like the gold or oil of previous generations, and that development makes a tool like Keshif all the more impactful and important. The data visualization platform makes it easy for people without a design background to turn their information into something that's easily consumable for the average person, and it gives data professional control over how to present that information.
There are many different ways to present a given data set, from bar graphs to scatter plots to line charts and so much more. The decision on presenting data is almost as important as the data itself, at least when it comes to imparting actual insights, and Keshif is an easy way for professionals to make that decision.
What's Driving This Trend
- Data Visualization Tools
- Keshif's automatic data viz platform enables anyone to transform data into easily consumable visuals.
- Design Accessibility
- Keshif empowers individuals without a design background to create engaging data visualizations.
- Customizable Data Presentations
- Keshif gives data professionals control over how they present information to convey insights effectively.
Who This Affects Most
- Analytics Software
- Keshif's platform disrupts the analytics software industry by offering an intuitive and accessible data visualization solution.
- Market Research
- Keshif's tool presents an opportunity for market research firms to enhance their data reporting capabilities and deliver more impactful insights.
- Business Intelligence
- Keshif's automatic data visualization platform offers a disruptive innovation for business intelligence applications, enabling more intuitive data analysis and communication.