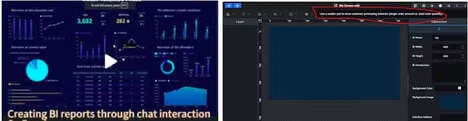
Yellowfin stands out in the crowded business intelligence and analytics space, offering a unique blend of embedded analytics that seamlessly integrates into any application. With its intuitive design and robust data governance features, Yellowfin not only enhances the usability and impact of dashboards but also empowers users with true self-service analytics. The platform's Guided Natural Language Query (NLQ) facilitates an intuitive interaction with data, allowing users to effortlessly generate ad-hoc reports and insights, thereby reducing the dependency on development teams.
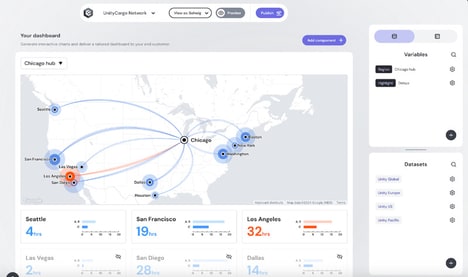
What sets Yellowfin apart is its ability to embed analytics anywhere within an application's workflow, using a simple API that requires minimal coding. This capability is bolstered by Yellowfin's comprehensive suite of analytics tools, including automated analysis, data storytelling, and custom JavaScript visualizations, ensuring that every data visualization need is met with precision and creativity.
Key Themes Behind This Trend
- Embedded Analytics Advancement
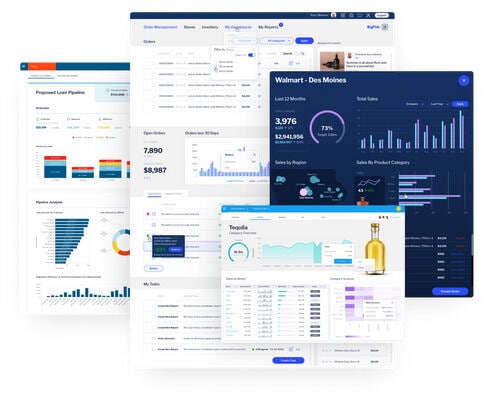
- The trend of advancing embedded analytics presents opportunities for businesses to seamlessly integrate powerful data storytelling capabilities into their applications.
- Enhanced Data Governance Features
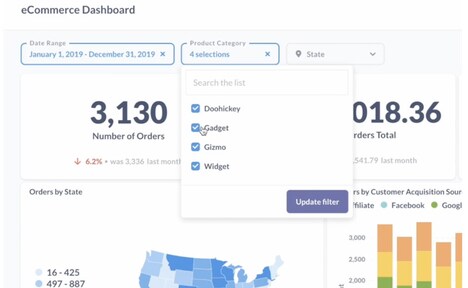
- The rise of enhanced data governance features in analytics tools offers businesses the opportunity to improve usability and impact of their dashboards.
- Guided Natural Language Query Integration
- The integration of Guided Natural Language Query (NLQ) in analytics platforms enables users to effortlessly generate ad-hoc reports, reducing dependency on development teams.
Where This Applies
- Business Intelligence
- In the business intelligence industry, the integration of powerful data storytelling capabilities can revolutionize how businesses make data-driven decisions.
- Analytics Software
- In the analytics software industry, the focus on enhanced data governance features presents opportunities to elevate the usability and impact of data visualizations.
- Data Visualization
- Within the data visualization industry, the incorporation of Guided Natural Language Query (NLQ) functionality can empower users to extract insights efficiently and independently.