
Histography is an incredible visualization that depicts the world's history as projected on Wikipedia. Wikipedia's history and evolution has been phenomenal and also very integral to the way we learn and share information on the Internet these days. However, few of us truly comprehend the speed at which Wikipedia has grown in terms of both content and influence in the sphere of world history.
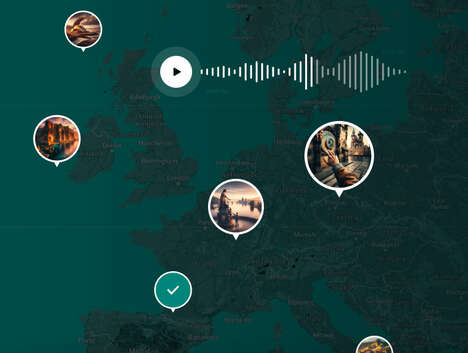
This beautiful infographic allows you to zoom in and see everything from the Big Bang up to more recent events. You can also access pre-determined time periods such as the Stone Age, Renaissance and the Industrial Age. You can even filter historic events by type if you're particularly interested in wars, scientific discoveries or literary achievements.
Histography makes for a wonderfully compelling and engaging way to appreciate our world's history. It makes one think whether this sort of visual depiction could be used more often to teach history in schools as it makes it so much more fun and interesting.
What Makes This Trend Stand Out
- Interactive Infographics
- Opportunity for educational institutions to use digital infographics and interactive platforms to make history more engaging and immersive.
- Data Visualization
- Opportunity for companies to use data visualization techniques to effectively communicate complex information, making it easier for consumers to understand.
- Content Curation
- Opportunity for businesses to curate content from online platforms like Wikipedia and present it in visually appealing and easily digestible formats.
Sectors Adopting This
- Education
- Interactive infographics can be used by educators to make learning more engaging and immersive for students.
- Media
- Opportunity for media companies to use data visualization to effectively communicate news and current events.
- Marketing
- Opportunity for marketers to present information in visually appealing and easily digestible formats to better communicate with consumers.