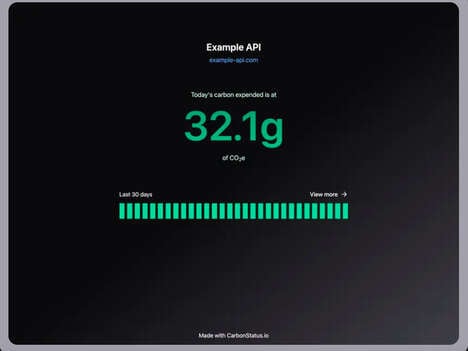

This 'Bring the Heat' infographic is a suggestive chart that seeks to look into the way in which climate affects a region's emission levels.
The chart presents some pretty convincing data, showing that areas with colder climates have emissions that are on the decrease, where the opposite appears to be true for naturally warmer locations. The chart itself is incredibly professional looking, and uses shades of green and red to present the information addressed. With many actual charts and a fair bit of text to contextualize the data provided, this infographic has a good balance between the two, and addresses the matter with a comprehensiveness that is often missing from this style of data visualization.
Well-designed, with an important message to pose, this infographic is sure to spark discussion about the factors that create and worsen issues of emissions.
What's Driving This Trend
- Climate-based Emission Levels
- Opportunity to research and develop technology and processes that can help mitigate the negative effects of climate-based emissions.
- Regional Emission Disparities
- Opportunity to create targeted policies and initiatives to reduce emissions in areas that are more significantly impacted by climate change.
- Comprehensive Data Visualization
- Opportunity to create more professional and informative visuals that can accurately convey complex data and information.
Who This Affects Most
- Renewable Energy
- Opportunity to innovate and invest in renewable energy sources that can reduce the impact of emissions on climate change.
- Environmental Consulting
- Opportunity to provide guidance and recommendations to organizations on how they can reduce their emissions and adopt more sustainable practices.
- Data Visualization Software
- Opportunity to develop software that can help individuals and organizations create more effective and visually appealing data visualizations.