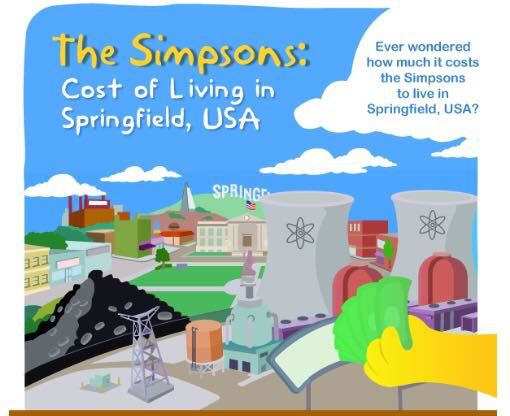
While society often considers the cost of personal living situations, this infographic focuses on a cartoon series to show the cost of The Simpsons lives in real life. This iconic cartoon series often shows the family traveling and partaking in extravagant adventures, but it's not very realistic.
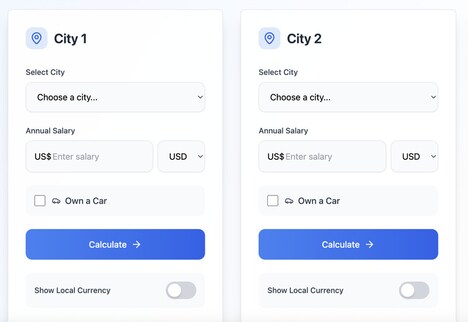
These images show how much the family would spend on all of their creative antics in reality. For example, if the family really lived in Springfield Oregon Homer's salary of $51,544 would not be enough to support the house, which costs $182,500.
Since the show has never revealed its true location, the creative minds at FatWallet created various options. This interesting graphic shows how much the Simpsons' lives truly cost in different areas of America. The chart provides a new way to view The Simpsons.
What's Driving This Trend
- Realistic Expense Charts
- There is a disruptive innovation opportunity to create realistic expense charts for other fictional characters and settings to give consumers a better understanding of economic and geographic situations.
- Living Cost Data Mining
- There is a disruptive innovation opportunity to mine and analyze living cost data from different TV shows and movies to find insights into human behavior and spending habits.
- Interactive Living Cost Visualization
- There is a disruptive innovation opportunity to create engaging and interactive living cost visualizations that allow users to explore and compare different locations and lifestyles.
Who This Affects Most
- Data Visualization
- The data visualization industry can leverage this trend to create more engaging and insightful visualizations of various economic data.
- Entertainment
- The entertainment industry can use this trend to create more realistic and relatable fictional characters and settings that resonate with audiences.
- Consumer Research
- The consumer research industry can use this trend to gain new insights into consumer behavior and spending habits by analyzing living cost data from different TV shows and movies.