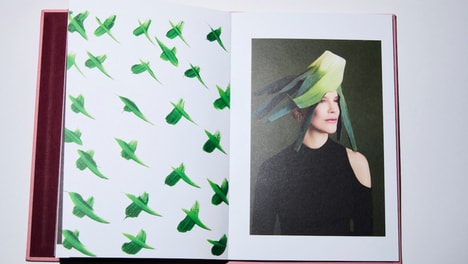
This series of photography infographics uses everyday objects and events to create the information-relaying images. Designed by German photographer Marion Luttenberger, the charts represent a refreshing change in the way graphs can be displayed and infographics can be organized. They are certainly a nice change from typography and stale illustrations.
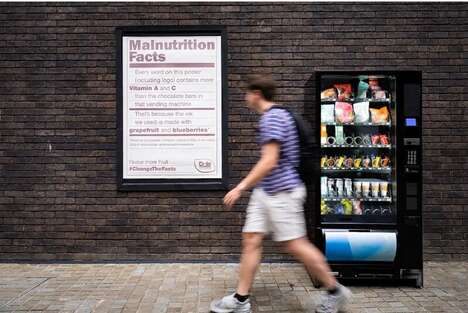
Commissioned by Caritas Kontakladen (an organization based in Austria that offers drug addicts support), the photography infographics use everything from hair length to sandwich ingredients and button-marked road maps to visualize important statistics and raise awareness. The images and information are often creatively correlated as well, like colored pencils sticking out of the ground to represent educational backgrounds or the gum stuck to the bottom of shoes to signify rates of infectious disease among addicts.
What's Driving This Trend
- Creative Infographics
- There is an opportunity for designers and marketers to create visually captivating infographics that use everyday objects and events to convey information in a refreshing way.
- Personalized Visual Data
- The use of personal anecdotes and relatable objects in infographics presents an opportunity to engage audiences and make data more relatable and memorable.
- Alternative Data Representation
- Visualizing statistics and information through unconventional objects and correlations offers a unique approach to data visualization.
Who This Affects Most
- Graphic Design
- Designers can explore innovative ways to create visually appealing and impactful infographics using everyday objects as inspiration.
- Social Awareness Organizations
- Organizations focused on creating awareness around various social issues can utilize creative photography infographics to convey facts and statistics in an engaging manner.
- Marketing and Advertising
- Marketers and advertisers can leverage the idea of using personalized visual data to create compelling campaigns that resonate with their target audience.