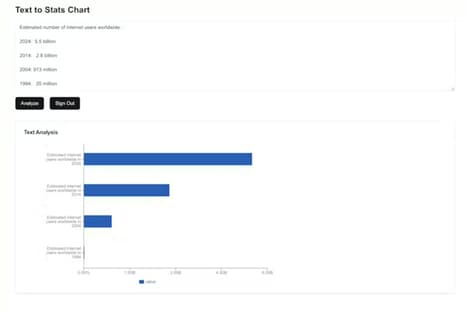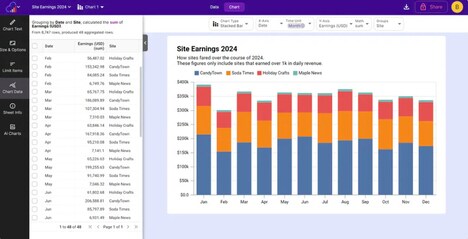
Charts Not Chapters is an AI-driven tool that transforms text and data into customized infographics. Unlike template-based solutions, the platform generates visuals directly through AI, offering greater flexibility and control. Users can adjust elements such as size, layout, and color to ensure the final product aligns with branding or presentation goals.
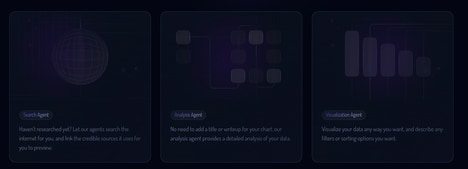
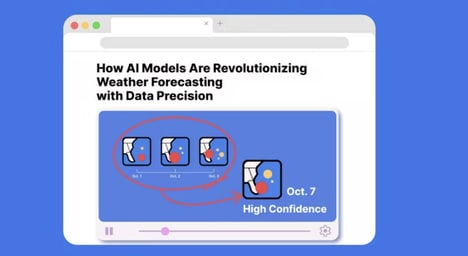
The system automatically selects appropriate formats and styles, streamlining the design process while maintaining adaptability. Beyond text and datasets, the tool can also convert YouTube content, images, and PDFs into infographic form, broadening its use cases. For businesses, marketers, and educators, this capability provides an efficient way to communicate complex information visually, improving engagement and comprehension. Charts Not Chapters reflects growing demand for tools that combine automation with creative control in data visualization workflows.
Image Credit: Charts Not Chapters
Why This Trend Is Growing
- AI-driven Infographic Creation
- The rise of AI in transforming text and data into infographics demonstrates a shift towards automation enhancing creative control and customization in design processes.
- Customization in Visual Communication
- Growing interest in tailor-made visuals over template-based designs indicates a trend towards more personalized and brand-aligned communication strategies.
- Multimedia Conversion Into Infographics
- With tools converting diverse content types like YouTube videos and PDFs into visual formats, there is an expanding scope for cross-platform visual storytelling.
Industries Being Reshaped
- Data Visualization
- AI solutions in data visualization are reshaping how complex information is communicated, making it more accessible and engaging for various professional sectors.
- Educational Technology
- In the edtech sector, innovative tools that convert traditional content into visual formats are enhancing learning experiences and increasing information retention.
- Digital Marketing
- The ability to create custom infographics directly from diverse content sources is transforming marketing strategies by enabling more dynamic and compelling brand narratives.