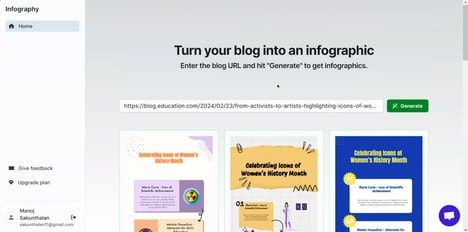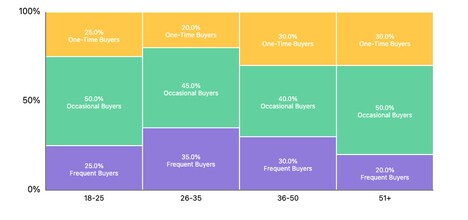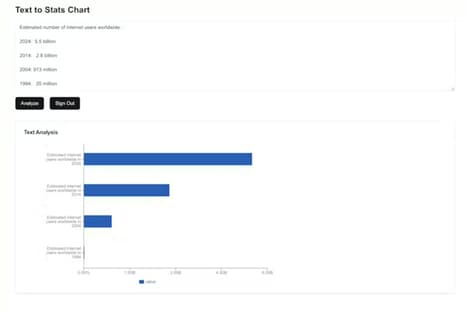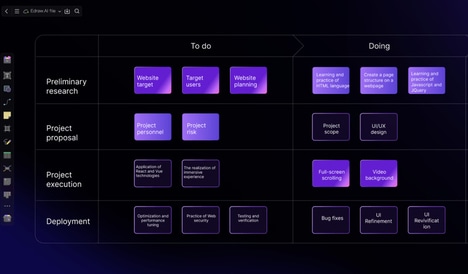
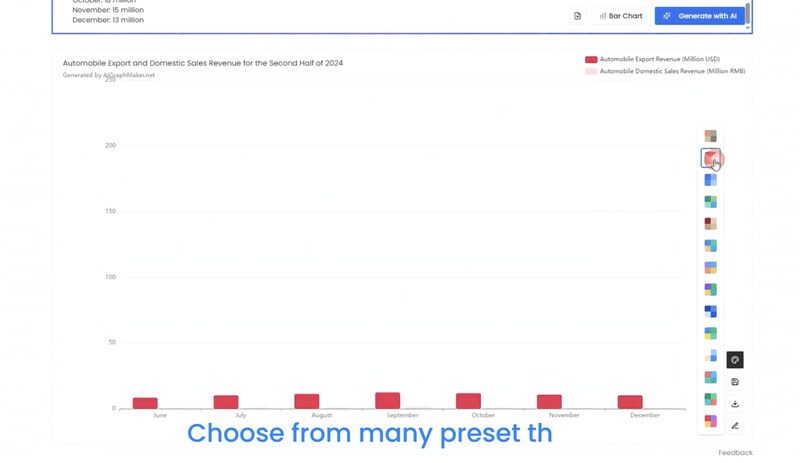
AI Graph Maker is a digital tool that converts raw data into charts, graphs, diagrams, and other visualizations quickly using artificial intelligence. Users can input datasets and generate visually coherent representations without manual formatting, significantly reducing the time and effort typically required for data visualization.
The platform is designed to accommodate a variety of visualization types, making it suitable for presentations, reports, and analytical work across industries. From a business perspective, AI Graph Maker exemplifies the growing trend of AI-assisted tools that streamline routine tasks, improve efficiency, and enhance data communication. By simplifying complex datasets into clear visual formats, it helps teams make data-driven decisions, identify trends, and communicate insights more effectively. Such tools are increasingly relevant in environments where rapid interpretation and presentation of information are critical.
Image Credit: AI Graph Maker
What's Driving This Trend
- AI-assisted Data Visualization
- Empowering users to efficiently transform complex data into understandable formats, AI-powered visualization tools are revolutionizing how information is communicated in business settings.
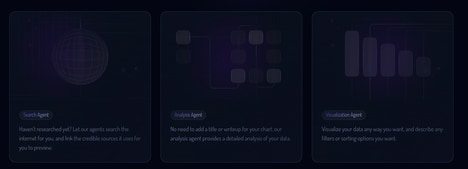
- Streamlined Data Processing
- AI tools are moving to the forefront as they dramatically reduce the time needed to convert raw datasets into actionable visual information, nurturing faster decision-making processes.
- Automated Insight Generation
- Automated platforms are offering businesses the capability to analyze and disseminate key insights rapidly through intuitive graphical representations, enabling a more agile approach to data interpretation.
Who This Affects Most
- Business Intelligence
- In the realm of business intelligence, AI-driven visual tools are enhancing how organizations extract and present insights, driving a more informed strategic decision-making process.
- Data Analytics
- The data analytics industry is experiencing a shift as AI technologies provide novel methods for visualizing and interpreting complex datasets more efficiently and accurately.
- Corporate Communications
- Corporate communications are evolving with AI visualization tools that enable clearer and more impactful sharing of data-driven insights across organizations and stakeholders.