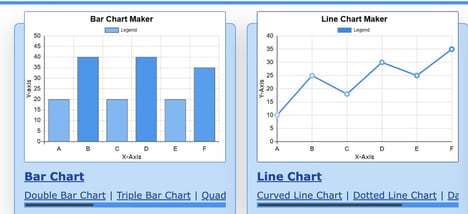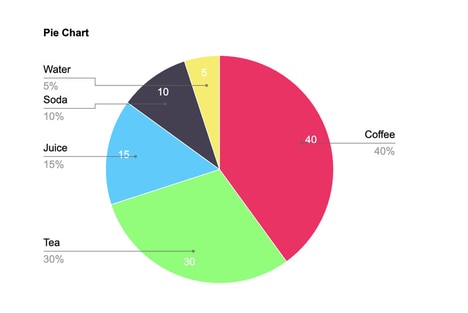
InstaCharts is a no-code data visualization tool designed for instant chart creation. It allows users to upload spreadsheet or Google Sheets data and generate charts and graphs in seconds. This tool simplifies the process of transforming raw data into visual insights, making it accessible for professionals without technical expertise.
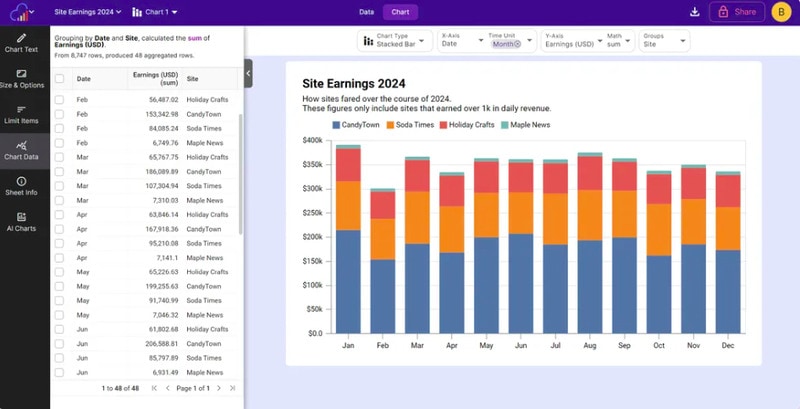
Users can export charts in various formats, share them with teams, or embed them into websites and reports. InstaCharts is particularly useful for businesses, marketers, and analysts who need quick visual representations of trends, performance metrics, or comparisons. By eliminating the need for complex software or manual chart creation, it streamlines workflows and enhances decision-making. With its intuitive interface and seamless integrations, InstaCharts provides a practical solution for turning data into actionable insights.
Image Credit: InstaCharts
What Makes This Trend Stand Out
- No-code Data Tools
- The rise of no-code data tools like InstaCharts democratizes data visualization, empowering individuals with minimal technical skills to create impactful visuals.
- Instantaneous Data Processing
- Instantaneous data processing tools are transforming how quickly professionals can interpret and act upon data insights, leading to accelerated decision-making.
- Embedded Analytics
- The integration of embedded analytics into websites and reports enables real-time data-driven storytelling, enhancing communication and engagement with dynamic content.
- Custom Visual Representation
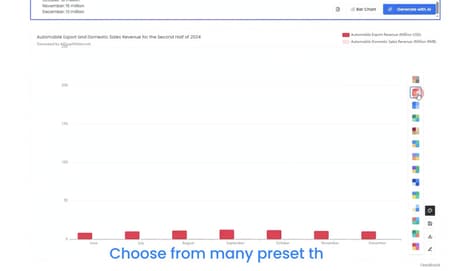
- Customization options in data visualization offer tailored insights, providing businesses with the ability to align visual outputs with specific branding and analytical needs.
Sectors Adopting This
- Business Intelligence
- Innovations in no-code visualization tools are reshaping the business intelligence landscape, enabling more comprehensive data exploration and reporting.
- Marketing Technology
- In the marketing technology sector, streamlined visualization tools offer marketing professionals new ways to analyze and present consumer data quickly.
- Data Analytics Services
- Within data analytics services, instant visualization capabilities present opportunities to differentiate offerings with user-friendly, adaptable insight presentations.