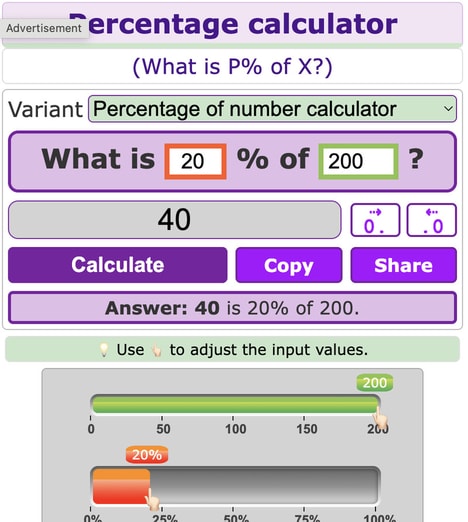
Pie Chart Maker is an online tool that allows users to create pie charts quickly and efficiently. The platform is designed for simplicity, enabling users to generate charts with a single click. Users can input data, customize the chart’s appearance, and export the final product in multiple formats, including JPG, PNG, and SVG.
The tool supports adjustments such as color schemes, labels, and segment sizes, providing flexibility for presentations, reports, or visual data analysis. From a business perspective, Pie Chart Maker streamlines the visualization process, reducing time spent on manual chart creation and eliminating the need for complex software. Its accessibility and ease of use make it suitable for professionals, educators, and students who need to communicate data clearly and visually.
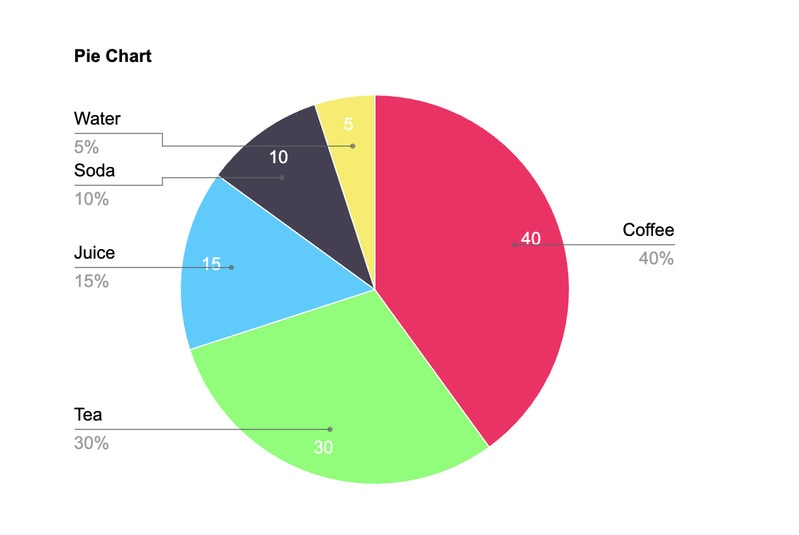
Image Credit: Pie Chart Maker
What Makes This Trend Stand Out
- Customizable Data Visualization
- The rise of simple, online tools like Pie Chart Maker highlights a growing demand for customizable data visualization options that move beyond traditional, complex software.
- Instantaneous Chart Creation
- Instant chart creation platforms capitalize on the need for speed and efficiency in data presentation, supporting professionals who prioritize time-saving technologies.
- Exportable Visual Content
- Tools that offer diverse export options cater to the increasing need for flexible visual content that can seamlessly integrate across different media formats.
Sectors Adopting This
- Edtech
- Educational technology benefits from intuitive tools like Pie Chart Maker as they support teachers and students in seamlessly presenting complex information.
- Business Intelligence
- The business intelligence industry sees growth opportunities in platforms that simplify data visualization, making analytics more accessible across organizational levels.
- Graphic Design Software
- Innovation in graphic design software is driven by user-friendly applications that eliminate the steep learning curves associated with traditional tools.