
The Visual Percentage Calculator is a digital tool designed to simplify percentage-related calculations through a visual and interactive interface. It enables users to quickly determine percentages, find percentage changes, and apply percentage formulas without needing advanced mathematical skills.
This tool is particularly useful for professionals in business, finance, and education who regularly work with data, pricing, or performance metrics. By presenting calculations visually, it improves comprehension and speeds up decision-making. For educators and students, it serves as a practical aid in learning and teaching percentage concepts. Its user-friendly interface also makes it accessible for general use, such as calculating discounts, tips, or interest rates in everyday life. With a focus on clarity and usability, the Visual Percentage Calculator bridges the gap between numerical analysis and intuitive understanding.
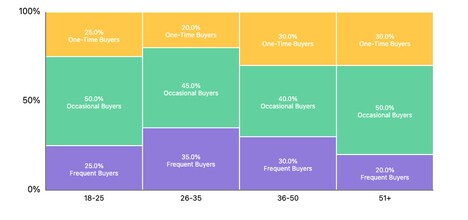
Image Credit: Visual Percentage Calculator
What's Driving This Trend
- Visual Learning Tools
- The rise of visual learning tools is transforming how complex mathematical concepts are communicated and understood.
- User-friendly Math Applications
- The development of user-friendly math applications is democratizing access to advanced calculation methods without requiring deep mathematical expertise.
- Interactive Educational Technologies
- Interactive educational technologies are enhancing traditional teaching methods by integrating engaging visual aids and real-time feedback.
Who This Affects Most
- Educational Software
- The educational software industry is being reshaped by tools that offer interactive and visual approaches to learning complex subjects.
- Financial Technology
- Financial technology is leveraging intuitive interfaces to make complex data analysis more accessible and comprehensible for users.
- E-learning Platforms
- E-learning platforms are innovating by incorporating interactive elements that facilitate easier understanding and retention of educational content.