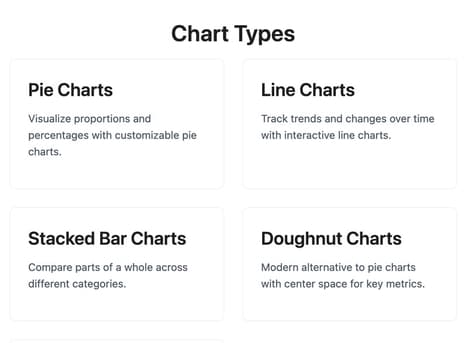
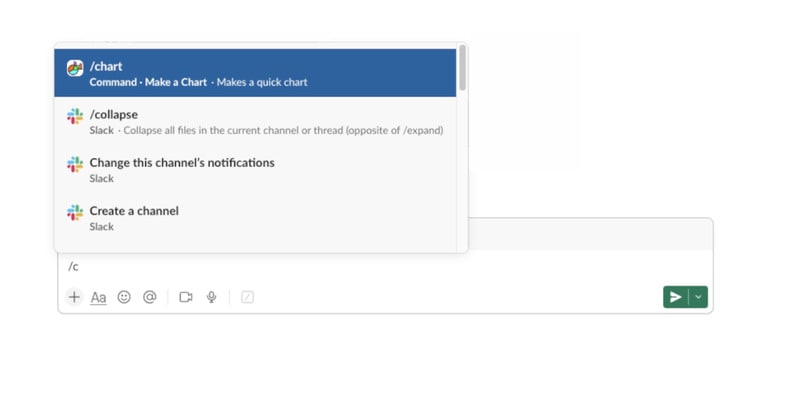
Make a Chart is a Slack-integrated tool that allows users to quickly generate charts directly within Slack. Designed to minimize friction in the data visualization process, the tool eliminates the need to switch between platforms or use third-party charting software. Users can paste raw data into a popup window, choose from various chart types, and instantly produce a visual representation — streamlining communication for teams working with data.
This integration is especially relevant for fast-moving environments where speed and clarity are critical, such as product teams, analysts, or internal reporting functions. By keeping everything inside Slack, it supports collaboration and reduces workflow interruptions. From a business perspective, it’s a lightweight but effective solution for improving data comprehension and decision-making across distributed teams.
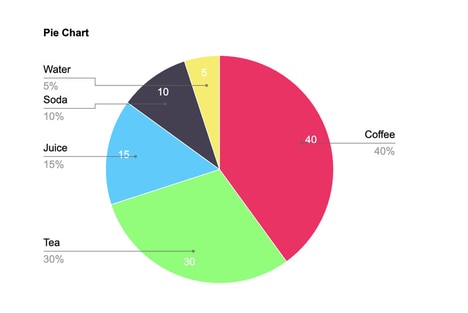
Image Credit: Make a Chart
Key Themes Behind This Trend
- Integrated Data Visualization
- The integration of data visualization tools directly into communication platforms streamlines workflows and enhances real-time collaboration.
- Instant Chart Generation
- Tools that offer instant chart creation from raw data within existing software environments foster rapid decision-making and efficiency.
- Frictionless Workflow Solutions
- Solutions that remove the need for platform switching in data processes are redefining how distributed teams manage information and maintain focus.
Where This Applies
- Collaboration Software
- Innovations that embed additional functionalities like data visualization directly within collaboration platforms are transforming team dynamics and productivity.
- Data Analysis Tools
- The evolution of data analysis tools to integrate seamlessly with communication software is reshaping how businesses approach information analysis and reporting.
- Enterprise Software Solutions
- The development of lightweight, multi-functional enterprise solutions that enhance workflow efficiencies is driving change in the way organizations handle internal processes.