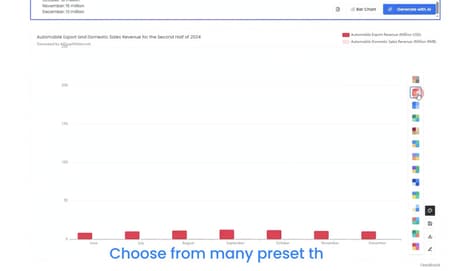
GraphFast is a browser-based tool designed to help users create line graphs quickly and with minimal setup. It focuses on transforming raw research or performance data into clear, visually polished charts without requiring design expertise or account registration.
Users can input data, adjust basic parameters, and generate publication-ready visuals in a short amount of time, making it suitable for researchers, analysts, students, and business teams working under tight deadlines. By prioritizing speed and simplicity, GraphFast reduces the friction often associated with data visualization tools that require complex configuration or learning curves. The product positions itself as a lightweight alternative to full-featured analytics platforms, emphasizing fast output over deep customization. For business-focused users, it supports rapid insight sharing, clearer reporting, and efficient communication of trends without added overhead.
Image Credit: GraphFast
What Makes This Trend Stand Out
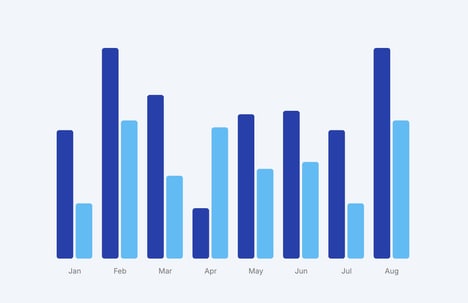
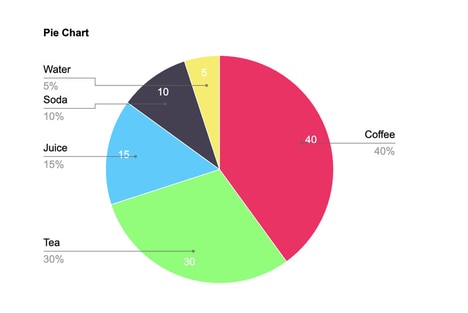
- Instant Data Visualization
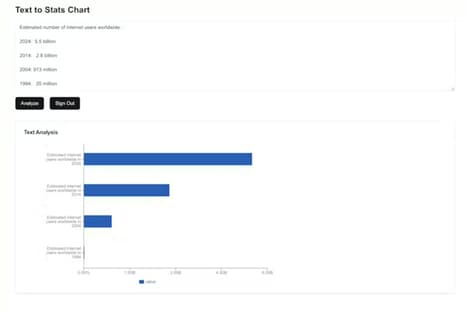
- The rise of tools like GraphFast reflects a growing demand for instant data visualization solutions that prioritize speed and simplicity over extensive feature sets.
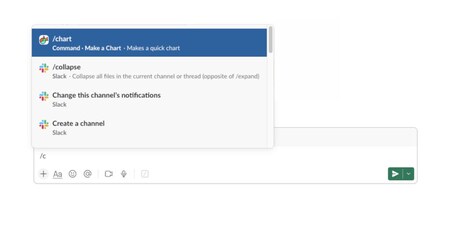
- No-registration Software
- The development of no-registration-required platforms highlights a shift towards increasing accessibility and reducing barriers for software users.
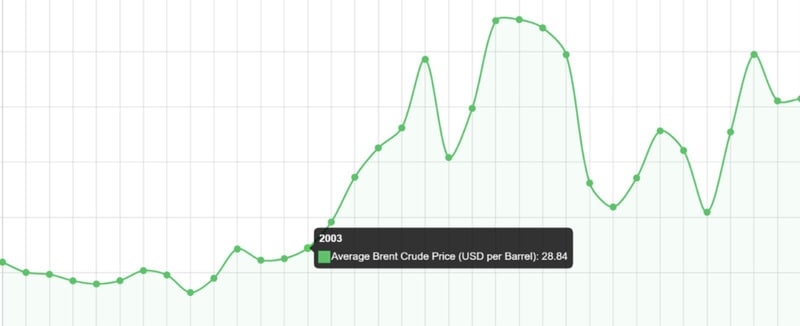
- Simplified Data Interpretation
- There is an increasing trend towards tools that facilitate simplified data interpretation, enabling users to quickly turn complex datasets into understandable insights.
Sectors Adopting This
- Data Analytics Software
- The data analytics software industry sees disruption from new entrants offering streamlined, easy-to-use tools that cater to non-experts.
- Educational Technology
- In educational technology, platforms that provide quick and visual learning aids are reshaping how students and educators interact with data.
- Business Reporting Tools
- Business reporting tools are being transformed by solutions that support efficient, clear communication of data insights without requiring extensive training.