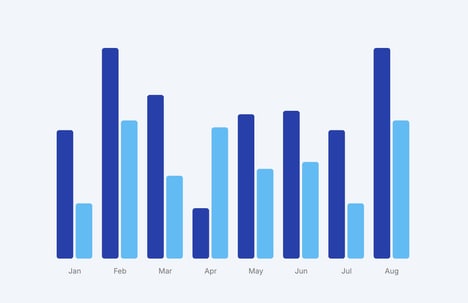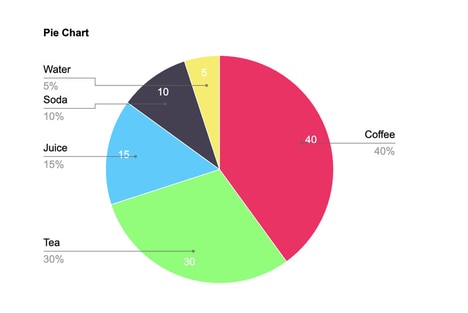
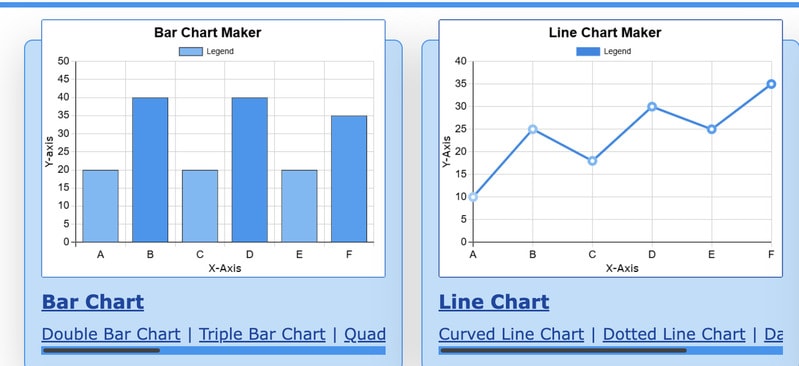
Free Chart Maker is a web-based tool that enables users to create charts quickly without requiring technical expertise or software downloads. The platform supports various chart types, allowing individuals and businesses to visualize data for presentations, reports, or analysis.
Its browser-based functionality ensures accessibility across devices and eliminates installation barriers, making it suitable for teams, educators, and professionals who need rapid chart generation. Users can input data directly or upload datasets, customize chart designs, and generate visualizations that are ready to share or embed. By simplifying the chart creation process, Free Chart Maker helps organizations communicate data insights effectively and reduces reliance on more complex, subscription-based software. It provides a free, accessible option for creating professional-looking charts in a fast and user-friendly manner.
Image Credit: Free Chart Maker
Why This Trend Is Growing
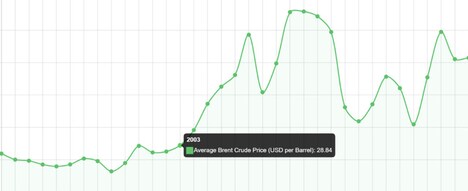
- Browser-based Data Visualization
- Widespread browser-based visualization enables immediate chart creation across devices, undermining the need for installed desktop analytics software.
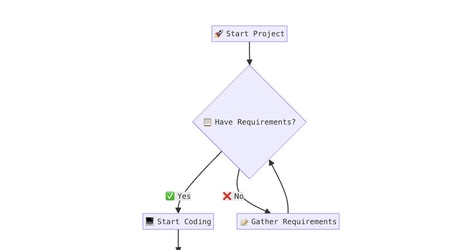
- No-code Charting
- Growing demand for no-code charting simplifies data story creation for nontechnical users, reshaping the market away from expert-only visualization tools.
- Collaborative Real-time Editing
- Increasing emphasis on collaborative real-time editing allows teams to co-create and iterate visualizations together, challenging single-user, siloed workflows.
Industries Being Reshaped
- K-12 and Higher Education
- Free, accessible charting tools reduce barriers for educators to integrate data literacy into curricula, disrupting traditional textbook and lab software purchases.
- Small and Medium Businesses
- Cost-free, easy-to-use chart makers enable SMBs to produce professional reports without analytics teams, altering reliance on expensive subscription platforms.
- Market Research and Analytics
- Rapid, browser-based visualization streamlines the presentation of survey and research findings, challenging established firms that depend on complex visualization suites.