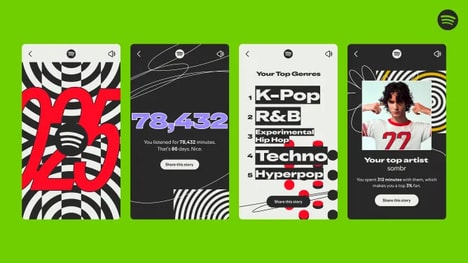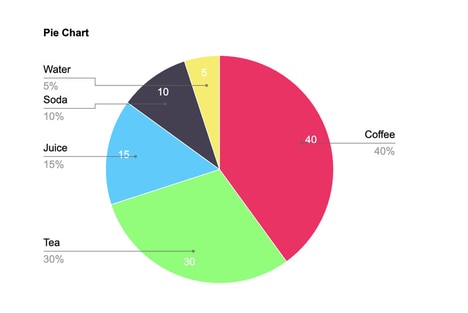
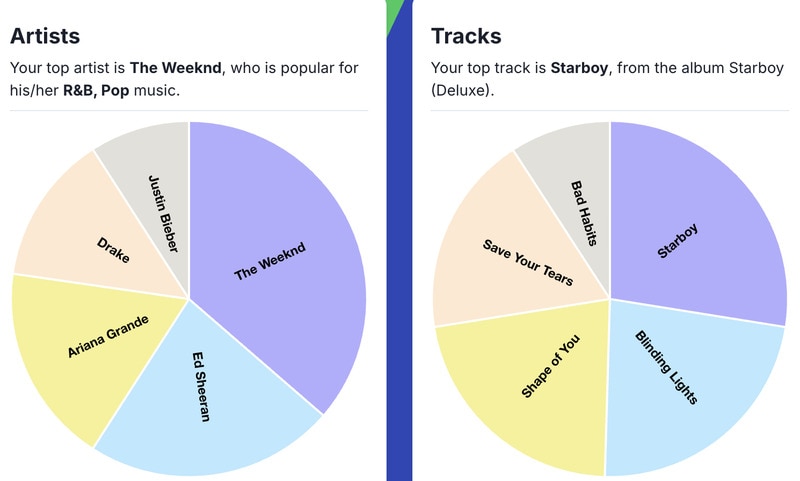
Spotify Pie Chart is a web-based tool that generates personalized pie charts reflecting a user’s music listening habits. By analyzing data from a Spotify account, the platform visualizes the distribution of genres, artists, or tracks, providing an intuitive snapshot of musical preferences. The tool is designed to be accessible, requiring minimal setup and offering free usage without complex configurations.
From a business and analytical perspective, tools like Spotify Pie Chart demonstrate the value of data visualization in enhancing user engagement and personal insight. It allows users to interpret patterns in consumption behavior quickly, making abstract streaming data tangible. This approach aligns with broader trends in personalized analytics and social sharing, where visualized insights encourage exploration, discussion, and sharing of user-specific trends in a meaningful, engaging way.
Image Credit: Spotify Pie Chart
What Makes This Trend Stand Out
- Personalized Data Visualization
- The rise in personalized data visualization highlights the potential to transform complex data sets into user-friendly formats, enhancing comprehension and engagement.
- User-centric Analytics
- Increasing demand for user-centric analytics tools empowers individuals with tailored insights, fostering greater understanding and interaction with their personal data.
- Social Sharing of Personal Insights
- Sharing personal insights through social media platforms is becoming more popular, offering a way for users to express individual preferences and connect with like-minded communities.
Sectors Adopting This
- Music Streaming Services
- Innovations in music streaming services that incorporate data visualization tools provide new avenues for user engagement and service differentiation.
- Data Analytics Software
- The data analytics software industry can leverage user-friendly visualization techniques to appeal to a broader audience, enhancing market competitiveness.
- Social Media Platforms
- Social media platforms are poised to benefit from integrating visualization tools that promote user content sharing, potentially boosting platform interaction and engagement.