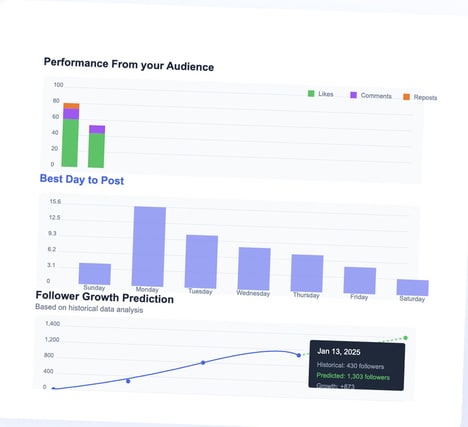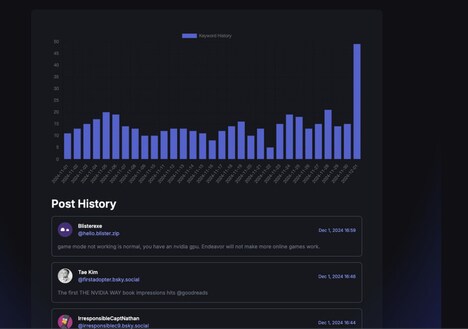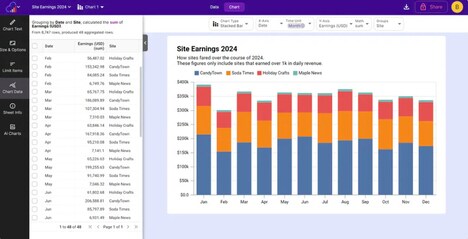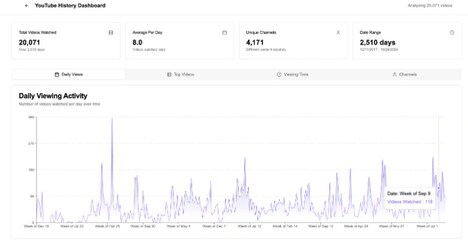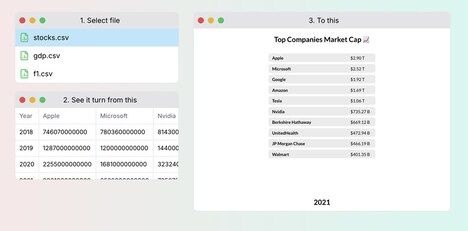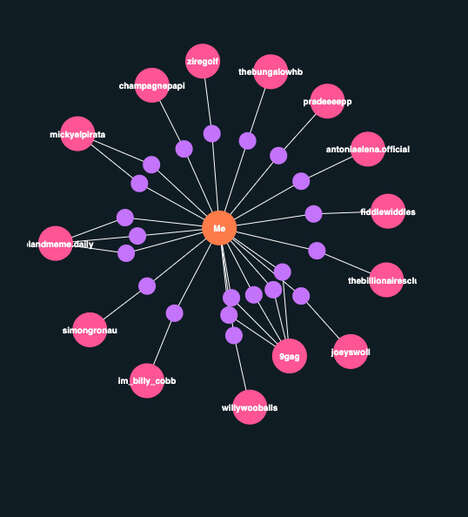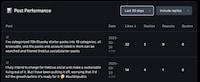
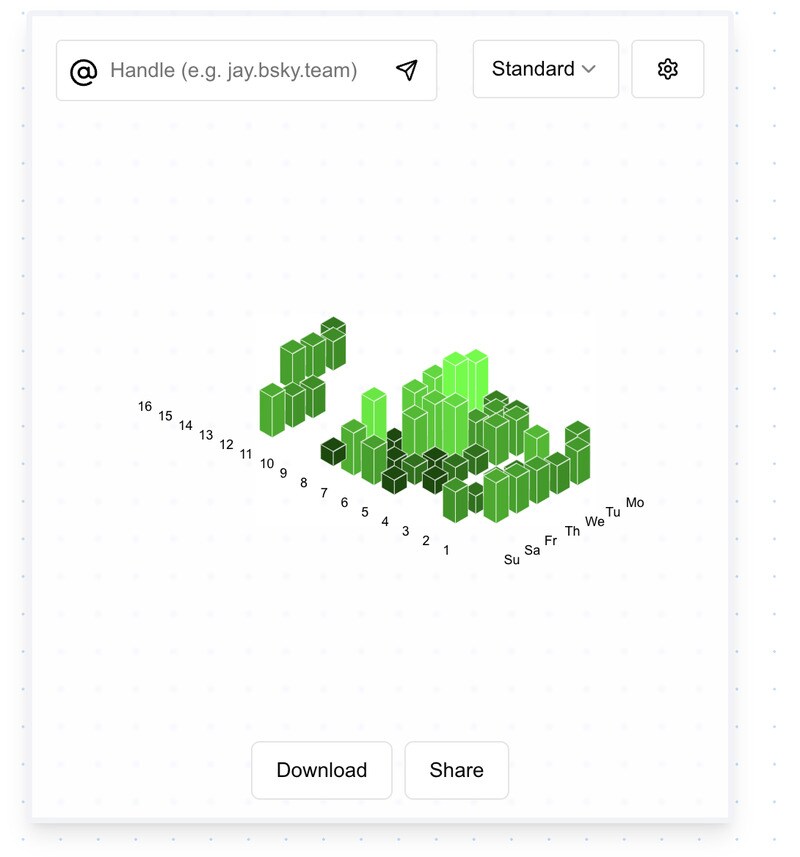
3D Bluesky Chart is a visualization tool designed to provide users with an interactive overview of their weekly activity on the Bluesky platform. By transforming engagement data into a three-dimensional chart, it allows individuals to observe patterns, trends, and peaks in activity over time.
This can help users understand how they interact with content, track consistency, and identify periods of high engagement. For social media managers and content creators, such visualizations offer insights into user behavior, content performance, and scheduling optimization. The tool emphasizes clarity and aesthetic presentation, making complex datasets easier to interpret. By converting quantitative activity metrics into an intuitive visual format, 3D Bluesky Chart supports data-driven decision-making and performance analysis, illustrating how graphical representations can enhance understanding and strategic planning for digital engagement.
Image Credit: 3D Bluesky Chart
What's Driving This Trend
- 3D Data Visualization
- Transforming quantitative metrics into three-dimensional visual representations enhances comprehension and strategic planning for digital platforms.
- Interactive Engagement Analysis
- Tools offering interactive visual overviews of platform activity can uncover behavioral patterns and improvement areas in user engagement.
- Data-driven Content Strategy
- Utilizing visual analytics to track content performance aids in optimizing scheduling and tailoring material to maximize audience interaction.
Who This Affects Most
- Social Media Management
- Visual tools that simplify data comprehension can revolutionize content strategy, scheduling, and overall engagement techniques.
- Data Analytics Software
- The integration of intuitive, aesthetic design in analytics software facilitates greater user understanding and actionable insights.
- Digital Marketing
- The ability to translate complex datasets into digestible visuals allows marketers to more effectively develop and adjust campaigns for target audiences.