RankReel is a data visualization tool that transforms datasets into animated ranking charts. Designed for users who want to illustrate change over time, the platform enables quick creation of dynamic visuals that track trends, performance, or competition. By turning raw numbers into engaging visual narratives, RankReel supports clearer communication and enhanced storytelling.
Its user-friendly interface makes it accessible to marketers, educators, content creators, and analysts looking to convey insights more effectively. From a business perspective, RankReel addresses the growing demand for shareable, visual data content in presentations, reports, and social media. The tool’s ability to animate ranking changes adds a temporal layer to data analysis, helping stakeholders see not just static values but evolution over time—critical for decision-making and audience engagement.
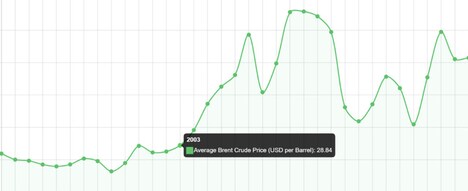
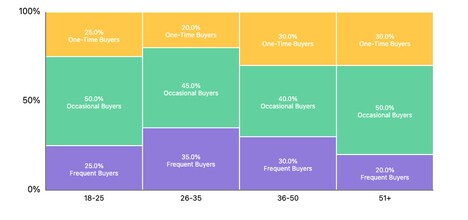
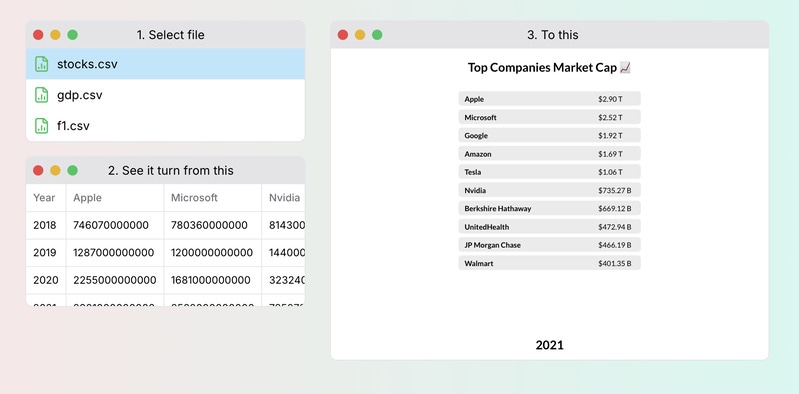
Image Credit: RankReel
Why This Trend Is Growing
- Animated Data Storytelling
- Bringing datasets to life with animations allows for more engaging and understandable visual narratives, meeting the need for dynamic presentations.
- Temporal Data Analysis
- The integration of time-based changes into data visualizations enhances the ability to analyze trends, offering deeper insights into evolving patterns.
- Shareable Visual Content
- The increasing demand for shareable and captivating visual content in social media and reports drives innovation in data visualization tools.
Industries Being Reshaped
- Marketing and Communications
- The industry is set to benefit from tools that convert complex data into visually appealing, animated content for effective storytelling.
- Education and E-learning
- Interactive and animated data visualizations are transforming how data concepts are taught and understood, making complex information more accessible.
- Data Analytics and Business Intelligence
- Revolutionizing the way data insights are presented, these visual tools improve stakeholder decision-making through clearer and more dynamic visual narratives.