This unique chart shows consumers a list of mood-enhancing foods that they should eat depending on where they are. The chart is titled 'What Kind of Hangry are You?' and it aims to help consumers improve moods by providing the perfect snack options.
The word "hangry," which was recently introduced into the dictionary describes the emotion of being angry due to hunger. This helpful chart gives suggestions on how to combat this feeling whether consumers are at the mall, on a road trip or in a bar.
Being hungry can certainly have an impact on anyone's mood, but this mood-enhancing chart is a guide to preventing negative emotions. For example, the chart reveals that the best way to combat being hangry while at work is to grab some satisfying trail mix.
What Makes This Trend Stand Out
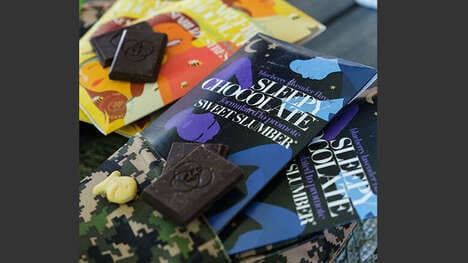
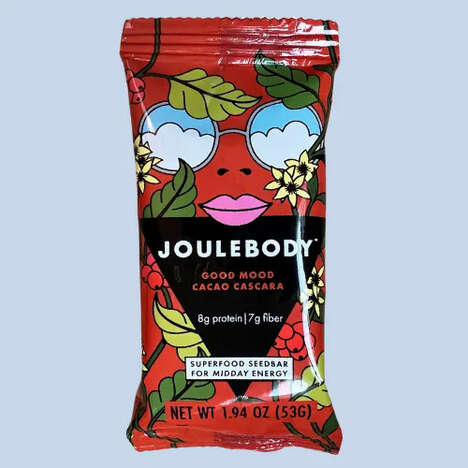
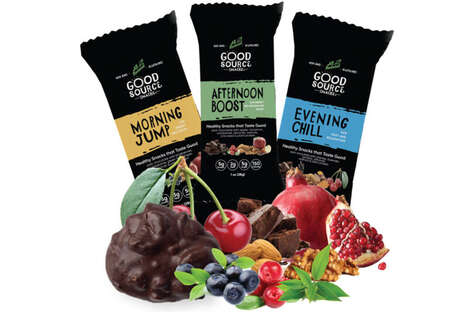
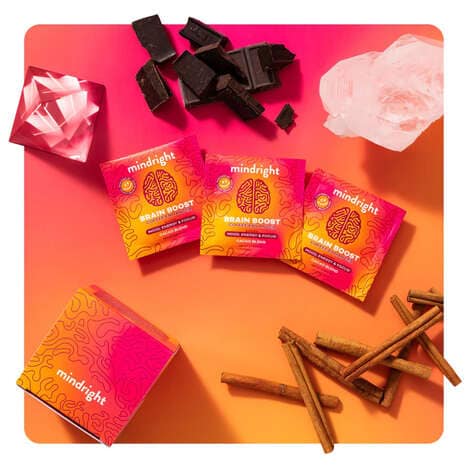
- Mood-enhancing Foods
- Disruptive innovation opportunity: Develop and market a line of mood-enhancing food products that target specific emotions.
- Emotion-based Snacking
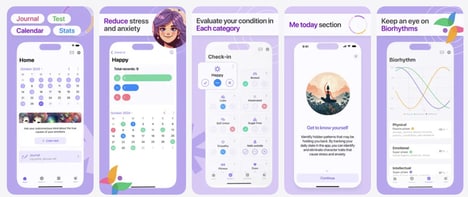
- Disruptive innovation opportunity: Create an app that suggests snack options based on the user's mood and location.
- Hangry Management
- Disruptive innovation opportunity: Offer hangry management services such as personalized meal plans or food delivery to improve mood and productivity.
Sectors Adopting This
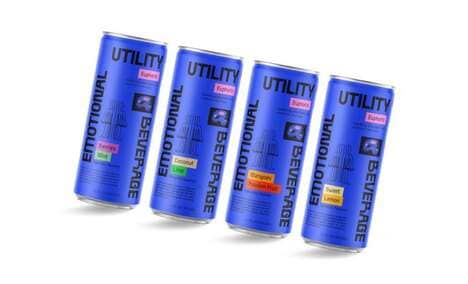
- Food and Beverage
- Disruptive innovation opportunity: Introduce a new category of mood-enhancing food and beverage products that cater to specific emotional states.
- Health and Wellness
- Disruptive innovation opportunity: Develop a line of supplements or functional foods that target mood enhancement and provide nutritional support.
- Technology
- Disruptive innovation opportunity: Create an AI-powered emotional intelligence platform that uses data analysis to recommend mood-regulating activities and food choices.