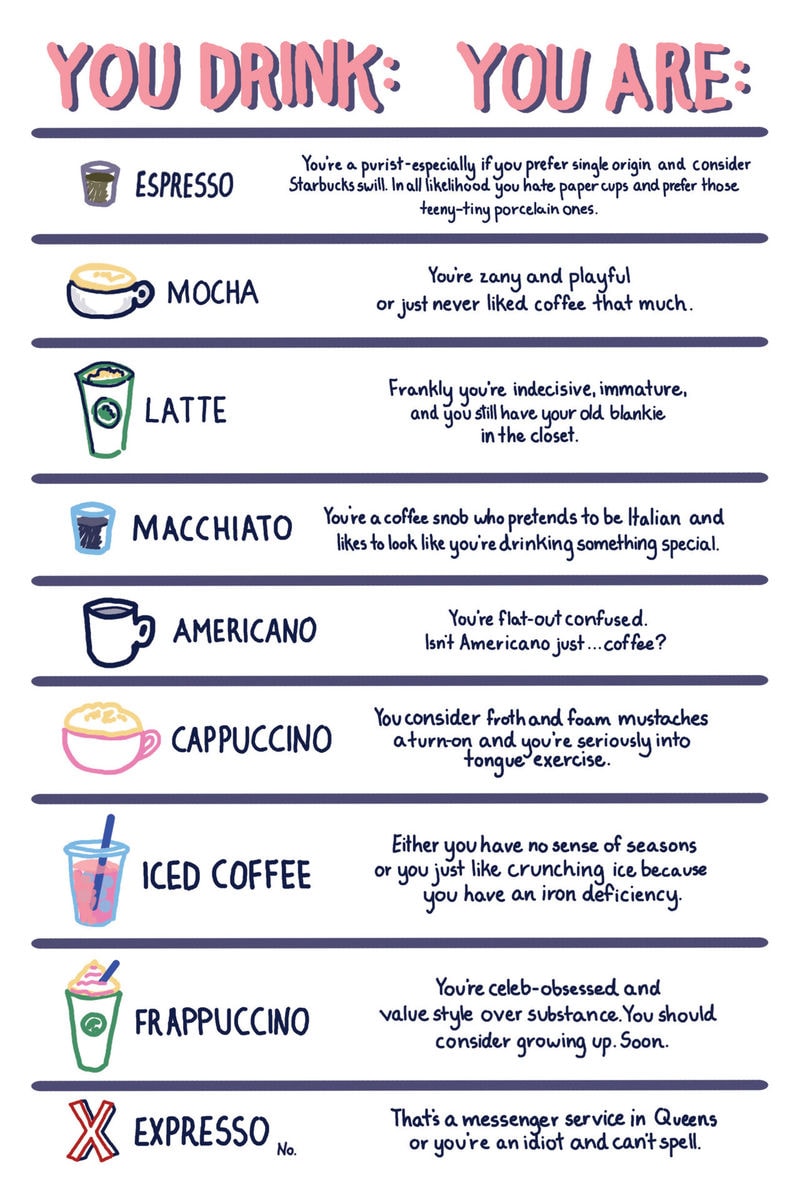
Author Mitchell Kriegman created this enlightening inforgraphic that determines one’s personality type based on their favorite coffee drink.
From iced coffee to espresso, this guide reveals what each consumer's favorite coffee drink says about them. For example, Kriegman’s chart says that those who enjoy a mocha are either ‘zany and playful’ or they just never liked coffee that much. The list goes on, and the personality types range from rude to comical, but the chart was simply made to enhance the reader’s experience of Kriegman’s new book.
The guide is part of the author’s new book titled ‘Things I Can’t Explain: A Clarissa Novel.’ The book’s main character is passionate about coffee, which was the inspiration for this chart. The full graphic is contained within the novel, which will be available for consumer purchase on November 10th, 2015.
Key Themes Behind This Trend
- Personalized Coffee Culture
- The use of favorite coffee drinks to determine personality types opens up opportunities for targeted marketing and customized coffee experiences.
- Creative Personality Profiling
- The creation of infographics and charts to depict personality types based on consumer preferences can be used in various industries for market segmentation and customer profiling.
- Enhancing Reader Experience
- Integrating interactive graphics and visuals within books and novels can enhance the overall reader experience and create new opportunities for immersive storytelling.
Where This Applies
- Coffee Retail
- Coffee retailers can leverage the concept of personalized coffee culture to create customized drink experiences and targeted marketing campaigns.
- Market Research
- Market research agencies can use creative personality profiling techniques to gather consumer insights and develop targeted advertising strategies.
- Publishing
- Integrating interactive graphics and infographics within novels and books can enhance reader engagement and provide additional value to the reading experience.