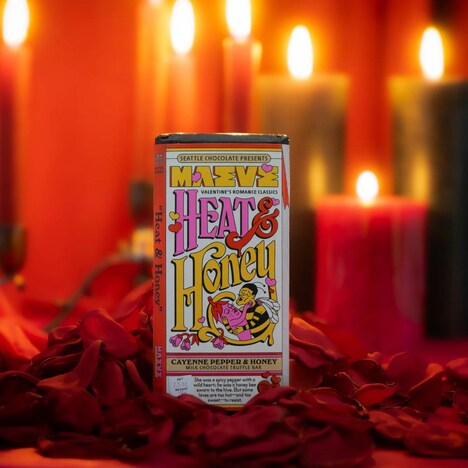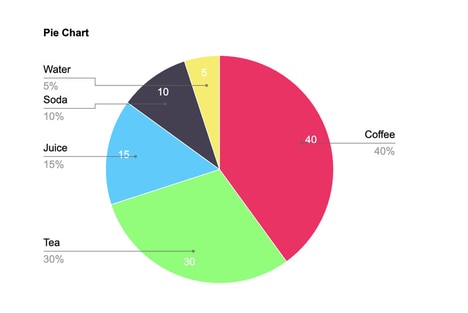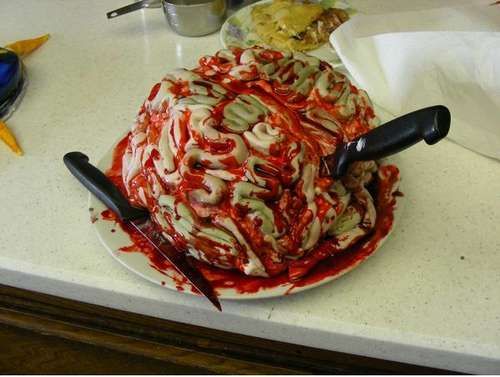
Although the numbers may not add up, Mary and Matt’s chocolate pie chart is 70% milk chocolate, 20% dark chocolate, 10% white chocolate and 100% delicious. I can think of no better way to get a gal excited about graphs and charts.
This has to be one of the most hilarious forms of treats out there on the market. A perfect gift for the number-loving lover in your life, this chocolate pie chart is a match made in mathematical heaven.
Key Themes Behind This Trend
- Chocolate Treats
- Disruptive innovation opportunity: Explore new flavors and presentations of chocolate treats, such as pie charts, to attract novelty-seeking consumers.
- Edible Charts
- Disruptive innovation opportunity: Develop edible charts made from various food items to merge the worlds of food and data visualization.
- Mathematical Food
- Disruptive innovation opportunity: Combine mathematics and food to create unique products that appeal to both intellect and taste buds.
Where This Applies
- Confectionery
- Disruptive innovation opportunity: Experiment with unconventional confectionery products that integrate mathematical concepts to create a distinct market niche.
- Food Gift
- Disruptive innovation opportunity: Introduce quirky and novelty food gifts that cater to individuals with specific interests, such as mathematics.
- Data Visualization
- Disruptive innovation opportunity: Explore alternative mediums, like edibles, for presenting data and making it more engaging for a wider audience.