The Acosta Group has introduced its inaugural Affordability Tracker — a new research measure that evaluates grocery purchasing power by analyzing the relationship between the cost of a typical stock-up trip and median hourly earnings in the United States. This innovation offers a data-driven lens on how inflation and wage growth have interacted over recent years.
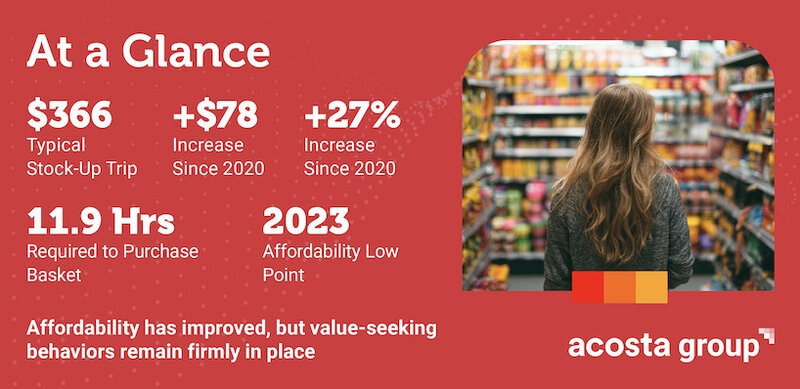
The Affordability Tracker's benchmark basket, comprising 84 commonly purchased grocery and household items, now costs over $366. This figure represents a 27% increase compared to a comparable basket in 2020, although wage growth has helped recover some of the purchasing power that consumers lost during the peak inflationary period, with affordability improving from its lowest point in 2023. Despite this recovery, the research indicates that many value-oriented shopping behaviors adopted during the inflationary surge have persisted, including heightened promotional engagement, active price comparison, and deliberate scrutiny of spending decisions.
Image Credit: Acosta Group
Why This Trend Is Growing
- Affordability Intelligence
- Retailers and brands are gaining value from analytics that connect wage growth, inflation, and basket costs to reveal shifting consumer purchasing power.
- Value-driven Shopping
- Persistent deal-seeking, promotion usage, and price comparison behaviors are reshaping grocery strategies beyond temporary inflationary periods.
- Benchmark Basket Tracking
- Standardized baskets of everyday goods provide a clearer view of household cost pressures and emerging demand changes across consumer segments.
Industries Being Reshaped
- Grocery Retail
- Supermarkets and food retailers can use affordability insights to refine pricing, promotions, and assortment strategies for cost-conscious shoppers.
- Consumer Packaged Goods
- Packaged goods companies face new opportunities in value-tier innovation, pack-size optimization, and promotional planning tied to affordability shifts.
- Retail Analytics
- Data providers are positioned to expand decision-support tools that translate economic indicators into shopper behavior and category performance insights.