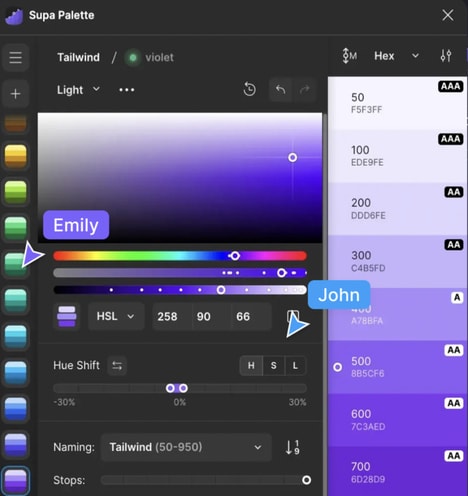
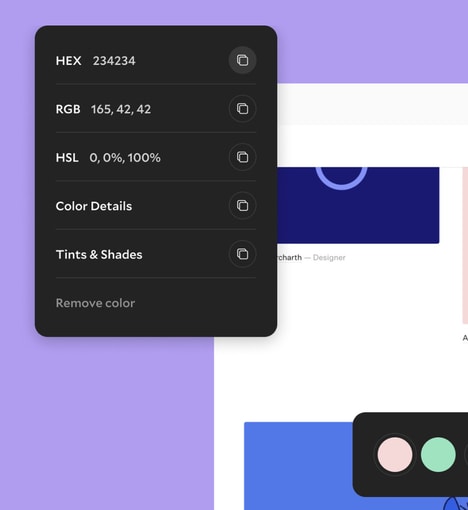
As Big Data is coming to play an increasingly important role in the very structure of economies and society as a whole, those who can help people to understand the data have power; 'Viz Palette' is a new tool that makes at least one aspect of data visualization easier. The tool is explicitly designed to help designers pick the colors in their data visualization graphics.
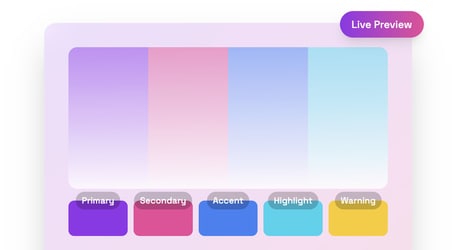
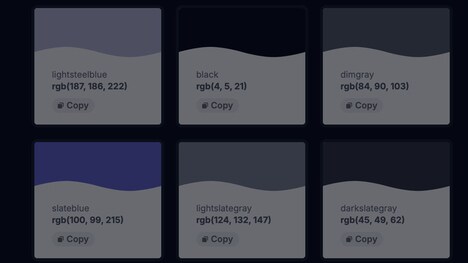
With the tool, designers can enter how many different colors that they're planning on using in their graphic, using as fine or broad a scope as they like in selection. The tool then lays those colors out in various popular graph formats, showing a sample of how those colors might look together. Viz Palette also includes buttons for testing how the colors would look to people with different forms of color blindness, thus building in inclusive practice.
What Makes This Trend Stand Out
- Data Visualization
- Disruptive innovation opportunity: Develop advanced data visualization tools to help users effectively communicate and interpret complex data.
- Inclusive Design
- Disruptive innovation opportunity: Create tools and technologies that promote inclusivity in design by considering diverse user needs, such as color blindness.
- User Experience
- Disruptive innovation opportunity: Improve user experience in data visualization by developing intuitive and user-friendly tools for color selection and graph design.
Sectors Adopting This
- Data Analytics
- Disruptive innovation opportunity: Integrate Viz Palette and similar tools into data analytics platforms to enhance the visual representation and analysis of data.
- Graphic Design
- Disruptive innovation opportunity: Incorporate Viz Palette-like functionality into graphic design software to streamline the process of color selection and visualization design.
- Accessibility Technology
- Disruptive innovation opportunity: Develop and market assistive technologies tailored specifically for individuals with color blindness to improve their experience with digital content.