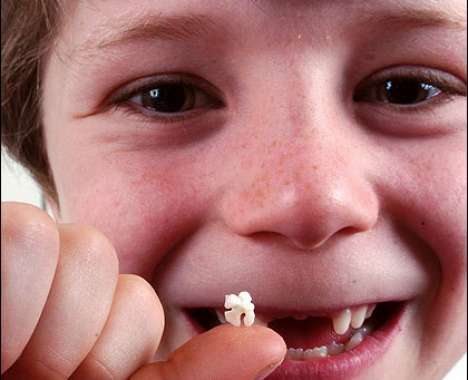

You know things are getting bad when even losing a tooth doesn’t get you what it used to. The Tooth Fairy is evidently now short on cash, as payouts to children are down about 10% over last year’s sum.
Last year, the average lost tooth garnered $2.09, whereas this year it only brings $1.88.
Dental companies Securian Dental and DeCare have been polling commercially insured members for over 10 years about how the Tooth Fairy practices her craft.
It seems that this year the higher scale of around $5 dollars has drastically declined, and $1 a tooth has become the norm (on average). The range of payouts per tooth has been from 5 cents to up to $40 a tooth over the 10-year period.
What Makes This Trend Stand Out
- Reduced Tooth Fairy Payouts
- As payouts to children from the Tooth Fairy decrease, companies may develop products or services that create alternative forms of incentives for children to prioritize dental health.
- Impact of Recession on Children’s Traditions
- As symbolic traditions like Tooth Fairy payouts decrease from the effects of economic recession, companies can explore how other family traditions or habits are also impacted and innovate accordingly.
- Changes in Family Spending Habits
- As the value of monetary gifts from the Tooth Fairy decreases, it may suggest changes in how families spend and allocate their money, which companies can examine to explore potential shifts in consumer behavior.
Sectors Adopting This
- Dental Care
- Companies in the dental care industry can create products or services that incentivize children and parents to prioritize dental health, as Tooth Fairy payouts decline.
- Family Leisure and Recreation
- As children’s symbolic milestones could suffer from the impact of recession, companies within the family leisure and recreation industry might examine various family habits and priorities to see what creates value for parents and children.
- Personal Finance
- As Tooth Fairy payouts decline in monetary value, companies in the personal finance industry can analyze how family spending habits transform and utilize this information to create potential products or services that help families save money.