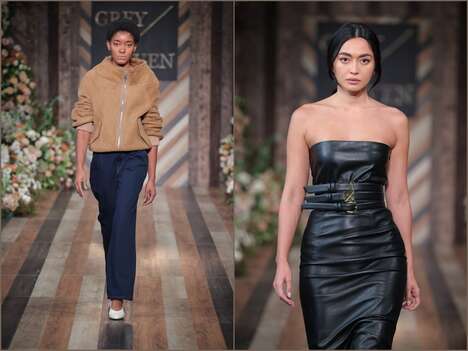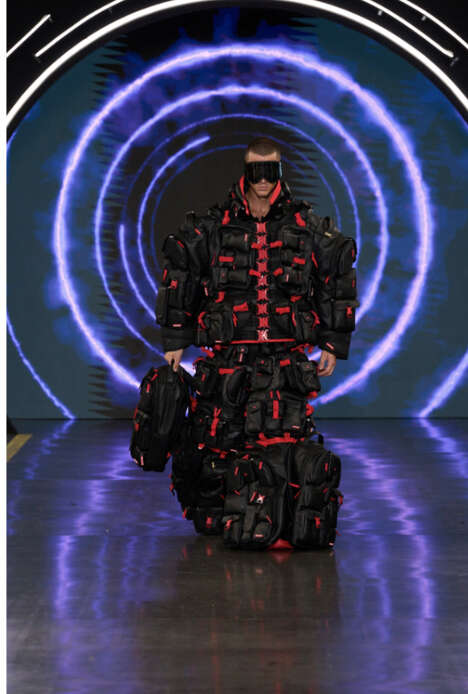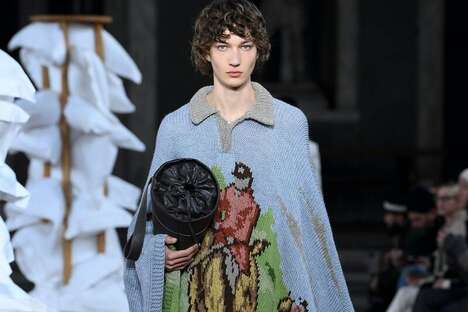
Eventup’s ‘The Evolution of Fashion Week’ infographic tracks the rapid development of New York’s Fashion Week. The company has proved essential to the smooth running of the event as it coordinates the renting of venues like the Metropolitan Pavilion, Guastavinos and Studio 450.
Eventup’s knack for real estate has translated to its research expertise. The chart begins with New York Fashion Week’s debut in 1943. The phenomenon took on a global shape soon after with offspring performances in Milan, Paris and London.
The quantitative diagram explains just how the New York-based show took the world by storm. The city is home to three of America’s best fashion schools and to designers Marc Jacobs, Victoria Beckham and Oscar De La Renta, making the grounds and its inhabitants privy to chic behavior.
What Makes This Trend Stand Out
- Fashion Event Evolution
- Event planning companies could create innovative methods to showcase the evolution of fashion events through infographics or dynamic visual aids.
- Real Estate Research
- Real estate companies could offer research services highlighting the historical development of a particular area or industry through detailed data visualizations.
- Globalization Infographics
- Companies can use infographics to illustrate the impact of globalization on multiple industries, and how those industries have changed over time.
Sectors Adopting This
- Event Planning
- Event planning and coordination companies could use research and data visualization to enhance the experience of guests and attendees, creating a more immersive and engaging experience.
- Real Estate
- Real estate companies could expand their services by offering research and data analysis for industries beyond their usual scope.
- Fashion Industry
- The fashion industry may benefit from using data visualizations to enhance the understanding of trends and pattern over time, leading to more streamlined and innovative ways to plan events and releases.