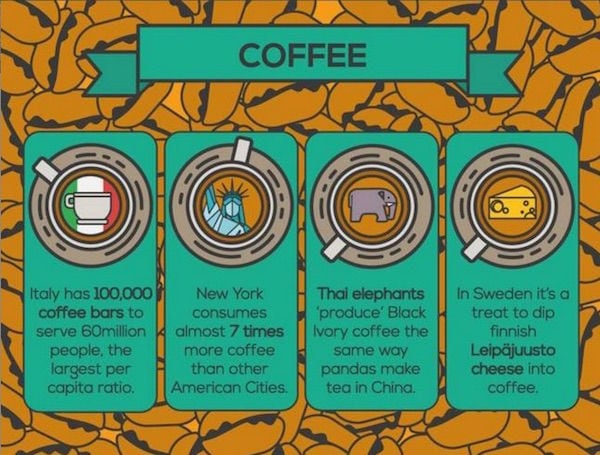
This coffee and tea infographic compares the two popular caffeinated beverages and even lists the health benefits of both. Created by Express Vending, the char 'Boiling Point: Battle of the Beverages' contains facts and figures about the bean and the leaf.
The coffee and tea infographic covers the origins, world culture, industry facts, health information, cost and more. The world is divided almost evenly with coffee in the West and tea in the East, with Thailand and England being major exceptions. According to the chart, 50% of Britons drink their tea with biscuits. In America's southern states 85% of the tea consumed is iced. New Yorkers drink almost seven times more coffee than people in other states. In Italy there are over 100,000 coffee bars for 60 million people.
Key Themes Behind This Trend
- Caffeine Beverages
- Opportunity for developing new and innovative coffee and tea products with unique flavors and health benefits.
- Global Caffeine Culture
- Opportunity to cater to regional preferences and cultural traditions related to the consumption of coffee and tea.
- Market Share and Consumption Patterns
- Opportunity for market analysis and targeted marketing strategies based on regional consumption patterns and preferences.
Where This Applies
- Food and Beverage
- Opportunity for coffee and tea manufacturers to capitalize on the growing demand for new and innovative caffeine beverages.
- Health and Wellness
- Opportunity for health and wellness industries to promote the health benefits of coffee and tea and develop products and services targeting health-conscious consumers.
- Market Research and Analysis
- Opportunity for market research and analysis firms to provide insights and data on global coffee and tea consumption patterns and trends.