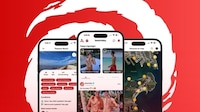


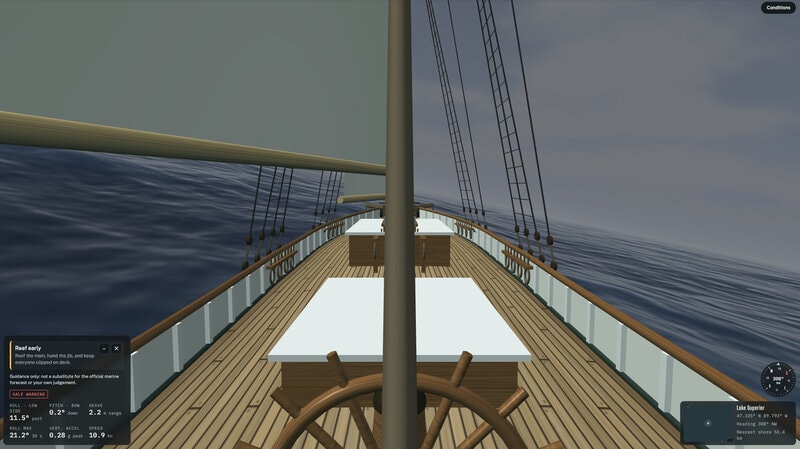
In The Lake turns buoy readings into a free Great Lakes simulator that lets visitors explore current water conditions without handing over tracking data. The site covers all five Great Lakes and includes Lake St. Clair, using color bands to show wave height in a digital lake scene.
When conditions spike, red sections can indicate waves of 10 feet or more. Users can stay with a passive floating view, while the teacher hub turns the same lake data into classroom material. That shift from map to immersive view makes the forecast easier to explore and spend time with.
Free access and no tracking data turn lake reports into an experience as much as a weather check. The buoy-fed view widens the audience beyond boaters by giving teachers and casual visitors a live, explorable picture of the region.
Image Credit: In The Lake
What Makes This Trend Stand Out
- Immersive Environmental Data
- Live sensor readings are being transformed into explorable visual environments, creating openings for platforms that make complex conditions easier for public audiences to understand.
- Privacy-first Public Tools
- No-tracking access to useful regional information reflects growing demand for digital services that build trust while expanding everyday utility.
- Classroom-ready Simulations
- Real-time data experiences are increasingly being adapted into educational resources, enabling learning products that connect science lessons to current local conditions.
Sectors Adopting This
- Edtech
- Interactive environmental simulators point to new learning formats where teachers can use live regional data to make science curricula more engaging.
- Weather Technology
- Forecasting services are moving beyond static maps toward immersive interfaces that help broader audiences interpret risk and changing conditions.
- Tourism and Recreation
- Accessible water-condition visualizations can reshape trip planning and outdoor recreation decisions by making lake safety information more intuitive.