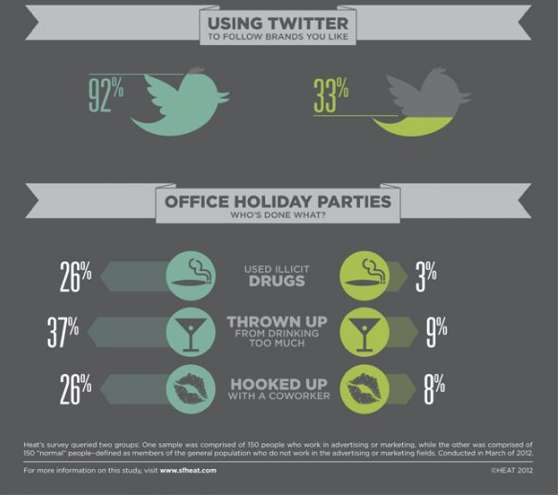
The 'How Are We Using Social Media?' infographic details the way that advertising and marketing agencies use Twitter, Facebook, Google+ and a a variety of other big-name media sites differently than the consumer does.
Created by Heat, an advertising agency from San Fransisco, California, the graphic compares the amount of users from each category (corporate versus consumer) that have accounts online and how their activity is often geared toward achieving different outcomes.
Most worthy of note was that the consumer uses social media far less than those in the professional realm and big companies are more likely to have an account than the people who they are selling product to. It is also interesting to see that more big companies believe that they should be engaging with their customers in the online sphere whereas the customers think that they should be less engaged.