


A Robotic Installation Creates Edible Gender Gap Data-Visualizing Desserts
Alyson Wyers — May 9, 2014 — Lifestyle
References: anninaruest & fastcoexist
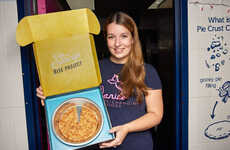
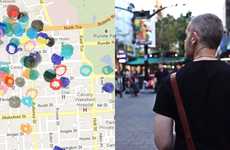
If you've ever seen a pie chart depicting the workforce gender gap, this literal pie chart puts a yummy spin on displaying information. Designed by artist Annina Rüst, a robotic installation places pie charts on edible pies to visualize gender inequality, specifically when it comes to women in technology.
With Pie Bot, you can tell misogynists to actually eat their outdated ideas. The gender gap data reflected in these pie charts are specific to inequalities in technical environments in Switzerland, such as universities, companies, conferences and the public sector.
A Piece of the Pie Chart is not just a robot, it is also a computer workstation that automatically tweets pictures of the pie. Intended to function in a gallery setting, the installation can receive visitors who are able to make their own pies.
Trend Themes
-
Robotic Installations — Using robots to create interactive art installations can revolutionize the way data is visualized and create unique experiences for viewers.
-
Edible Data Visualization — Combining food and data visualization can offer a novel approach to convey complex information in a more engaging and memorable way.
-
Gender Inequality in Technology — Visualizing gender gap data in the technology sector can bring awareness to the persistent inequalities and drive discussions towards overcoming them.
Industry Implications
-
Art and Design — Artists and designers can explore the use of robotic installations and edible data visualization techniques to create thought-provoking and interactive artworks.
-
Technology — The technology industry can leverage innovative approaches like robotic installations to showcase gender inequality data and inspire efforts towards achieving equality.
-
Food and Beverage — Food and beverage businesses can partner with artists to create edible data visualizations that raise awareness about social issues and contribute to unique dining experiences.
3.3
Score
Popularity
Activity
Freshness