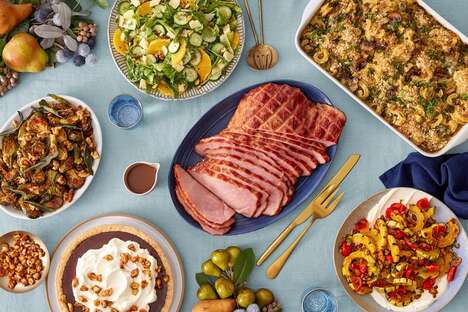
Whether you are aiming to provide a super traditional Thanksgiving dinner or are trying to incorporate cool new concepts, this infographic showcasing Thanksgiving food trends over the past two decades will be helpful. From the Food Network, ThanksGiving You 20 Years of Trends is a chart in two parts: 1994 to 2003 and 2004 to 2013. This way you can look at things in 10 year chunks.
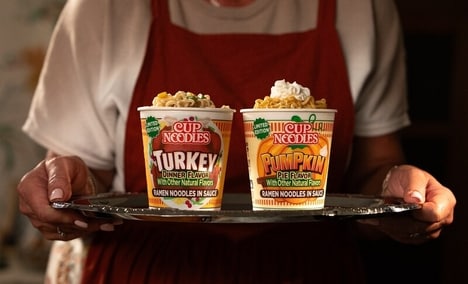
The infographic on Thanksgiving food trends highlights crazes such as 1995's tofurkey (a vegan version of the roast turkey and stuffing) and the introduction of the turducken in 2002. The tri-bird turkucken, of course, is a decadent and boneless beast composed of chicken stuffed in duck stuffed in turkey. The past decade recognized the versatility of brussels sprouts, creamed kale and brulled pumpkin pie.
What's Driving This Trend
- Thanksgiving Food Trends
- Businesses in the food industry can take advantage of these trends and offer traditional and trendy options, such as vegan and gourmet dishes.
- Food Infographics
- Opportunities exist for businesses to create innovative infographics to showcase their product history and evolution.
- Decade-wise Comparison Trends
- There is a potential for businesses to analyze and compare trends by decade and use the information to develop new concepts and improve existing ones.
Who This Affects Most
- Food Industry
- With Thanksgiving being a popular holiday, the food industry can use these trends to create innovative dishes and market them accordingly.
- Marketing Industry
- Marketers can utilize infographics like these to promote products and services and increase brand awareness among consumers.
- Data Analysis Industry
- The data in these infographics can be used by data analysis companies to help businesses analyze their product trends and make better business decisions.