Jeff Tyser and Kerryn-lee Maggs, writers of the travel blog Lost & Found, found a stimulating way to share their South Africa travel experiences with the blogosphere.
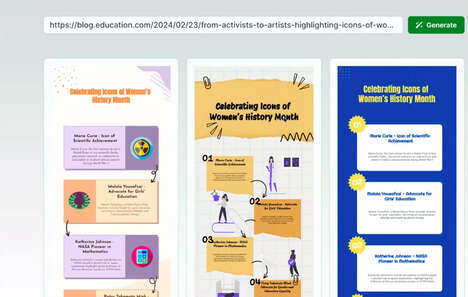
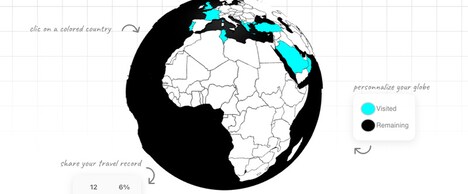
By creating a personalized infographic for each of the six countries they visited, the couple could impart statistics as well as significant events that happened on their journeys. The backgrounds feature a glorious view of each destination, with lots of interesting tidbits about the country and favorite memories that they took away with them in the foreground.
A travel log is great for those who really want to delve into details, but for someone looking for a quick synopsis on each trip, these South Africa travel infographics are a visually interesting way to share the juiciest bits.
What's Driving This Trend
- Personalized Infographics
- The trend of creating personalized infographics can be applied to various industries to effectively communicate statistical information in a visually engaging way.
- Visual Travel Guides
- There is an opportunity to disrupt the travel industry by creating more visually appealing and personalized travel guides for consumers.
- Data Storytelling
- Data storytelling is becoming an increasingly important trend, offering businesses the opportunity to communicate complex data in a more accessible way.
Who This Affects Most
- Travel and Hospitality
- The travel and hospitality industry can leverage personalized infographics to create more interesting and informative travel guides for consumers.
- Media and Publishing
- There is potential for media and publishing companies to use infographics to create more engaging and informative stories and news articles.
- Marketing and Advertising
- Marketers can harness the power of data storytelling to create more compelling campaigns that effectively communicate data-driven insights to target audiences.