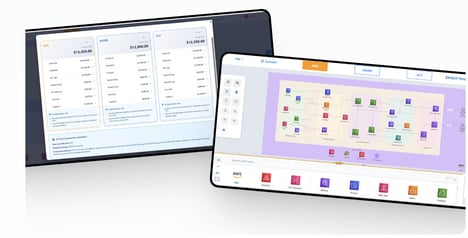
SDraw Tool is a visual system design app for creating architecture diagrams quickly and clearly. It is built to help teams map out complex systems without needing specialist diagramming software.
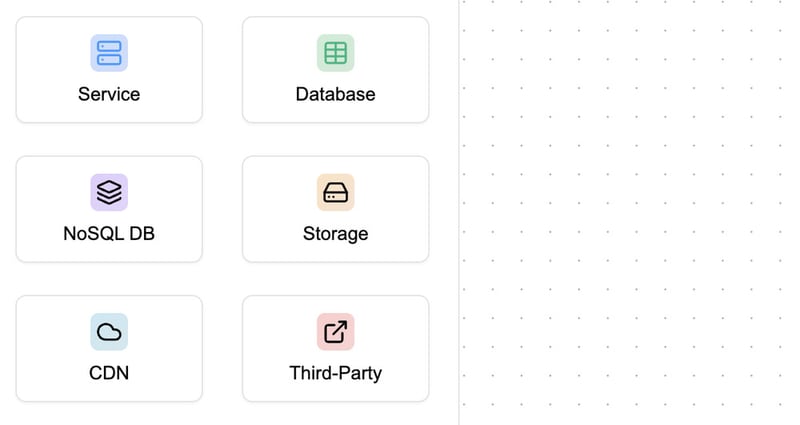
Architecture components can be placed on a canvas, connected through animated links, and organized into structured layouts. Color coding is used to separate services, databases, and infrastructure layers, making systems easier to read at a glance. The interface focuses on clarity and speed, allowing technical ideas to be translated into diagrams that are easy to share and discuss. It’s designed to reduce the effort needed to document or communicate system structures.
SDraw Tool is aimed at developers and engineering teams working on software architecture. It provides a more visual way to represent systems, helping improve understanding across technical and non-technical stakeholders.
Image Credit: SDraw Tool
What Makes This Trend Stand Out
- Visual System Modeling
- A shift toward canvas-based design tools that represent architectures as manipulable visual objects opens possibilities for model-driven code generation and automated validation.
- Real-time Collaborative Diagramming
- Live multi-user editing and animated connections enable synchronous system planning across distributed teams, creating opportunities for embedded collaboration platforms that tie diagrams to issue trackers and chat.
- Contextual Layering and Color Coding
- Semantic layering and color-coded components make complex stacks more comprehensible, suggesting novel UX patterns for adaptive views tailored to different stakeholder roles.
Sectors Adopting This
- Software Development
- Developer workflows that integrate visual architecture artifacts with code and tests could redefine how specifications and implementations remain synchronized.
- Cloud Infrastructure
- Providers of cloud services can leverage visual mapping of services and dependencies to offer managed topology visualization and automated remediation insights.
- Technical Education and Training
- Interactive diagramming tools that translate system views into stepwise tutorials present new formats for teaching architecture concepts to mixed-skill audiences.