What does your kid do in his/her recreation time? Hopefully they don't get into trouble, but if they do maybe this infographic will help you figure out what you need to focus them on.
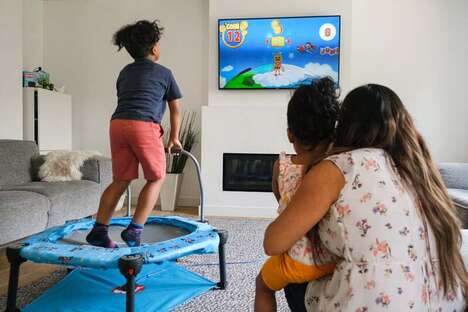
The average kid spends 7.5 hours a week watching television or DVDs. Surprisingly, the amount of time spent on the internet and gaming is lower than TV at 5 hours a week. However, in 2012 90% of kids are accessing the internet, so there are very few children who aren't on the net. On a non-electronic note, kids spend 3.5 hours of their recreation time each week reading for pleasure.
Only 60% of kids are involved in sports with the most popular choice for boys being soccer. For girls, swimming reigns supreme in terms of sports activities.
What's Driving This Trend
- Screen Time Statistics
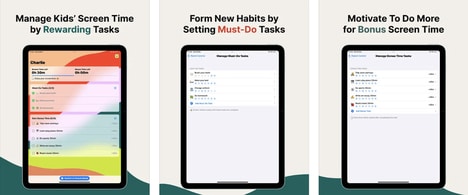
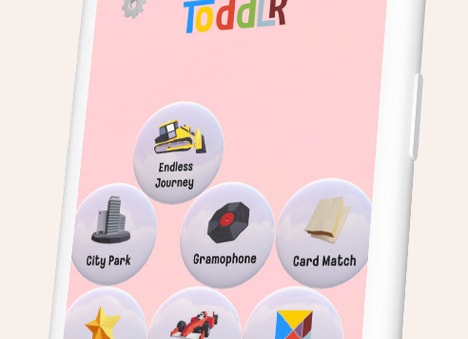
- Opportunities for innovators to create educational yet entertaining content to reduce screen time.
- Reading for Pleasure
- Opportunities to encourage children to read and promote literacy habits.
- Gendered Sports Preferences
- Opportunities for mixed-gender and non-traditional sports activities.
Who This Affects Most
- Edtech
- EdTech companies can create educational apps to reduce screen time and promote learning.
- Publishing
- Publishing industry can adapt to children's preferences for reading material and promote literacy habits.
- Sports and Recreation
- New opportunities for mixed-gender and non-traditional sports activities, coaches and facilities can tap into this market.