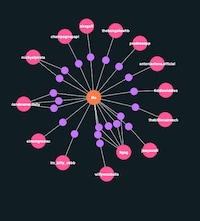


The NYC Twitter chart was assembled on behalf of James Cheshire, Ed Manley and Oliver O'Brien, students from the University College London (UCL). The UCL representatives took it upon themselves to monitor where and in what capacity diverse languages were spoken throughout New York.
Data was collected here via Twitter. Approximately 8.5 million Tweets were examined when putting together this study, speaking to its efficiency and relevancy to the city's residents.
Broadcasted posts were measured between January 2010 and February 2013. The team uncovered certain patterns as language-specific pockets were found, such as a greater concentration of diversity in language at the Theater District and at Times Square. Spanish and Portuguese were most frequently detected.
Why This Trend Is Growing
- Social Media Language Mapping
- Opportunity to use social media data to map language patterns for businesses and organizations.
- Urban Linguistic Analysis
- Opportunity to analyze linguistic patterns in urban environments and create relevant products and services accordingly.
- Real-time Language Monitoring
- Opportunity to develop real-time language monitoring tools for businesses and cities to stay informed of linguistic trends.
Industries Being Reshaped
- Social Media Analytics
- Social media analytics companies can leverage this data to provide insights into language patterns and demographics.
- Language Learning
- Language learning companies can use this data to create targeted language courses based on specific urban language patterns.
- Tourism & Hospitality
- Hospitality businesses can use this data to provide targeted services and experiences to culturally diverse populations in urban areas.