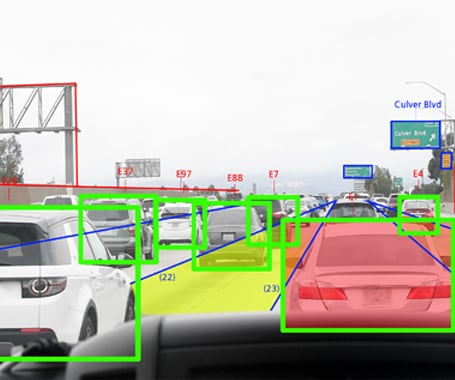

An interactive traffic map has been designed to combat the devastatingly high traffic-related deaths in Los Angeles. Vision Zero, an initiative attempting to eradicate traffic-related deaths by 2025, fell short of expectations after bearing witness to a 43% rise in road fatalities during the program's first year.
After discovering a small 6% portion of L.A roads were responsible for 66% of L.A's pedestrian deaths, researchers compiled their data into an interactive map which aims to help commuters select the safest route from point A to point B. Deaths are visually represented on the map as a red dot- the more dots clustered in one place indicates a more dangerous roadway.
The interactive traffic map also includes the name and age of the deceased, as well as a short description, or photo which adds a sense of humanity while also ensuring the person represented is not reduced to a statistic.
What's Driving This Trend
- Interactive Traffic Maps
- The use of interactive traffic maps to increase safety measures in high-risk areas can be highly beneficial and may lead to the development of other innovative transportation technologies.
- Vision Zero Strategies
- Developing innovative strategies like Vision Zero, to reduce traffic-related accidents can provide opportunities for growth and innovation in the transportation and technology industries.
- Data-driven Safety Measures
- Data-driven safety measures like the interactive traffic map can be applied to other industries and have the potential to change the way we approach safety concerns in different sectors.
Who This Affects Most
- Transportation
- Interactive traffic maps, along with other innovative transportation technologies, are set to revolutionize safety measures in the industry.
- Technology
- The development of data-driven safety measures and interactive traffic maps can lead to new and innovative technologies with applications in different industries.
- Urban Planning
- The collection and analysis of data in urban planning can be used to create safer streets and better communities, which can result in a more connected and inclusive society.