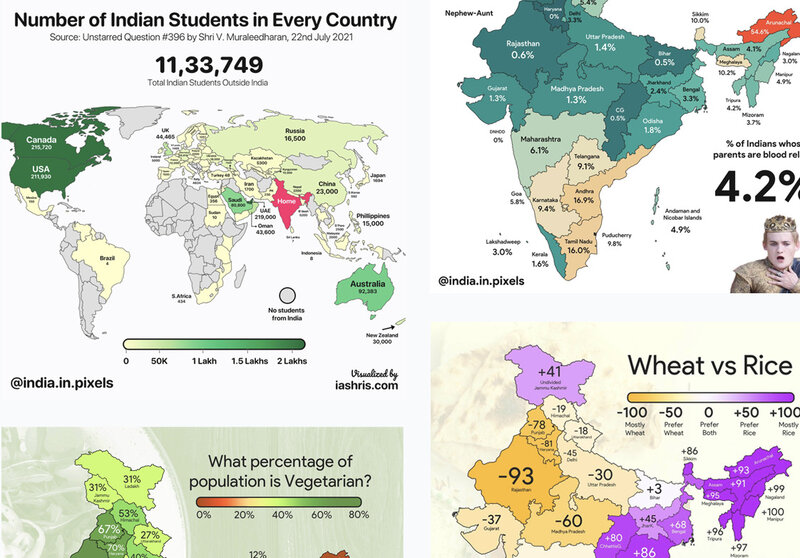
Turning raw PDFs and CSVs into clear, professional visuals can be time-consuming and often requires specialist design or data skills. iipmaps is a no-code platform that uses AI to clean and structure messy data, including columns and location information, before transforming it into maps, charts, and visual explainers.
Users can upload their data, choose from ready-made templates, and quickly export polished, on-brand visuals. Designed for businesses, government teams, FMCG brands, and startups, iipmaps makes it easier to turn complex information into content that is simple to understand and share. The platform can help teams create compelling materials for executive briefings, presentations, reports, and social media. iipmaps provides a faster way to turn raw data into visual stories without needing advanced design or data visualisation skills.
Image Credit: iipmaps
Key Themes Behind This Trend
- No-code Data Storytelling
- AI-powered visualisation tools are lowering the barrier to turning complex datasets into presentation-ready narratives, creating space for faster communication across non-technical business teams.
- Automated Data Cleaning
- Platforms that structure messy PDFs, CSVs, and location data can reduce reliance on specialist analysts while improving the speed and consistency of insight generation.
- Template-driven Visual Content
- Ready-made branded templates for maps, charts, and explainers signal a shift toward scalable content production for reports, briefings, and social media assets.
Where This Applies
- Business Intelligence
- Self-serve visual analytics platforms are expanding business intelligence access beyond data teams, supporting quicker interpretation of operational and market information.
- Government Technology
- Public sector teams can benefit from tools that convert fragmented civic, geographic, and administrative data into clearer visual materials for decision-making and public communication.
- Marketing Technology
- Automated visual storytelling systems are reshaping how brands transform performance data and consumer insights into polished campaign assets without dedicated design resources.