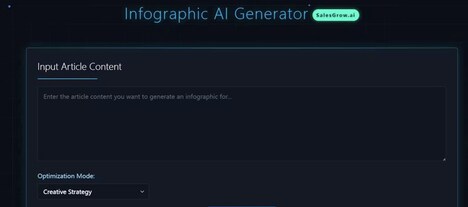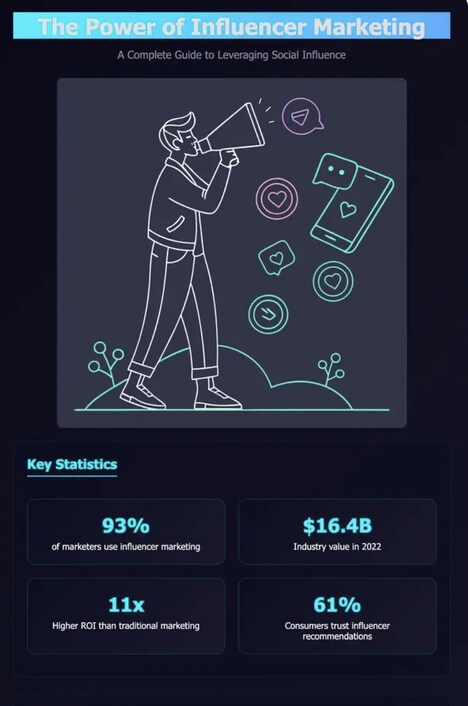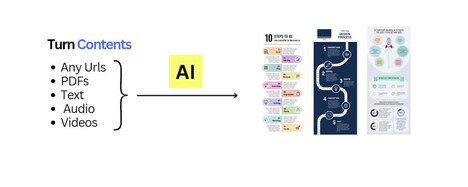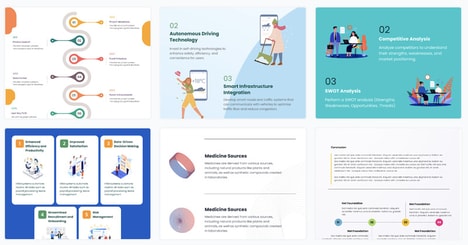
AI Infographics is a content creation platform that converts written text into editable visual infographics using artificial intelligence. Users input raw content, which the system transforms into structured, design-ready layouts suitable for blogs, presentations, reports, and social media.
The visuals remain customizable, allowing teams to adjust branding, layout, and emphasis without starting from scratch. By automating the initial design process, the tool reduces reliance on manual graphic design and shortens production timelines. It is positioned as a productivity aid rather than a full design suite, focusing on speed and accessibility. For businesses, AI Infographics supports clearer communication of data and ideas, enabling faster content repurposing across channels while maintaining visual consistency and reducing creative overhead. This approach aligns with modern workflows prioritizing efficiency, scalability, and rapid iteration across distributed teams.
Image Credit: AI Infographics
What's Driving This Trend
- Automated Visual Storytelling
- Platforms that translate narratives and data into coherent visual sequences offer the potential to displace manual infographic workflows by enabling rapid, scalable content production across channels.
- Template-to-brand Pipelines
- A system that auto-adapts template designs to enterprise brand guidelines could streamline brand-consistent output and reduce reliance on central design teams for routine assets.
- Text-to-design AI
- AI that converts plain text into editable, presentation-ready visuals creates an opportunity to shorten content creation cycles and democratize design skills among non-experts.
Who This Affects Most
- Marketing & Advertising
- Martech stacks integrating automated visual generation can shift campaign workflows by allowing faster A/B testing of creative variants and quicker multichannel asset production.
- Enterprise Knowledge Management
- Knowledge teams adopting editable visual summaries may transform how internal reports and SOPs are produced and consumed, improving comprehension and reducing update friction.
- E-learning & Instructional Design
- Instructional content that is auto-visualized from lesson text presents the chance to scale personalized learning materials and shorten course development timelines.