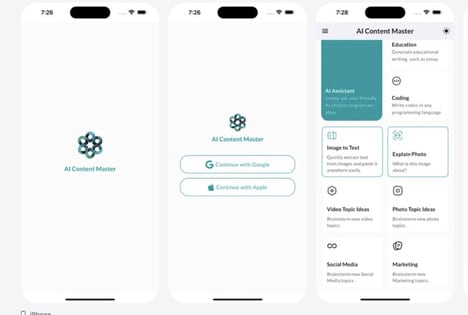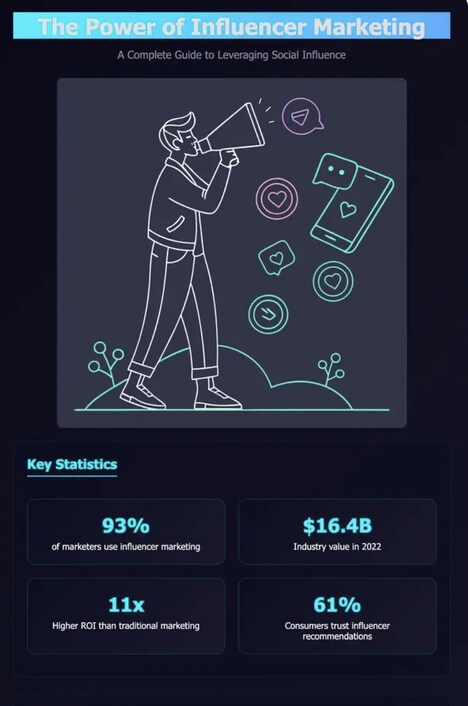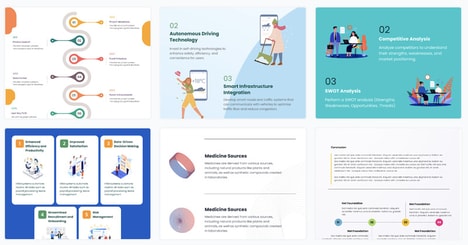
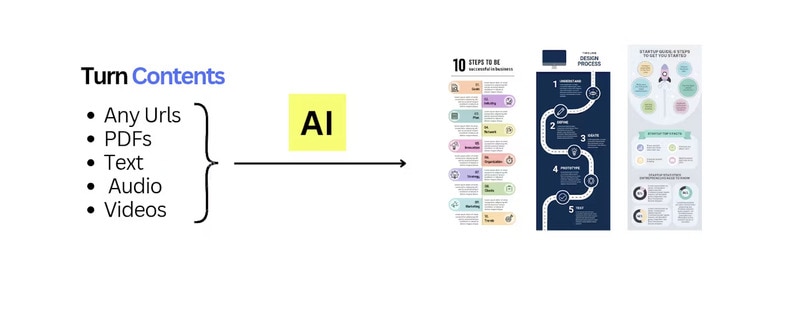
Infographic AI is a digital platform that automates the creation of visually appealing infographics from a wide range of content types, including text, blogs, news articles, PDFs, websites, audio, and videos. The platform uses AI to analyze and summarize information, transforming it into structured, shareable visual content without requiring design expertise.
From a business perspective, Infographic AI exemplifies the growing role of AI in content visualization and marketing. By reducing manual design work, it allows teams to quickly produce high-quality infographics for presentations, social media, and reports, improving communication efficiency and audience engagement. The platform aligns with broader trends in AI-driven productivity tools that streamline creative processes, making complex information more digestible, visually appealing, and actionable for decision-makers and audiences alike.
Image Credit: Infographic AI
Key Themes Behind This Trend
- AI-powered Visualization
- The rise of AI-powered platforms that convert complex data and media into easily digestible visuals is enhancing communication across industries.
- Automated Content Creation
- Automating the creation of visual content is transforming traditional marketing and communication strategies by enabling faster production without design expertise.
- Data-driven Storytelling
- AI tools that transform data into narrative-driven infographics are revolutionizing how businesses engage audiences and convey information.
Where This Applies
- Digital Marketing
- The digital marketing industry is being redefined by AI-driven visual tools that streamline content creation and improve audience interaction.
- Media and Publishing
- AI infographic platforms are disrupting media and publishing by enabling rapid conversion of textual and multimedia content into compelling visual stories.
- Education Technology
- EdTech is seeing innovations as AI tools facilitate the visualization of complex educational content, enhancing learning experiences and information retention.