The Billion Dollar-o-gram 2013, created by a blog called Information is Beautiful, is to the point, informative and interactive. Infographics can get painstakingly time-consuming to create, especially if hand-drawn or if they have a complex lay-out, but this one uses a generative code, which hyperlinks each bubble to a specific and informative webpage.
Billion-dollar tax evasions, bailouts and trillion-dollar deficits inspired this interactive infographic. From information on the pharmaceutical market to the USA’s foreign debt, this webpage thoroughly touches upon many components of the America’s budget.
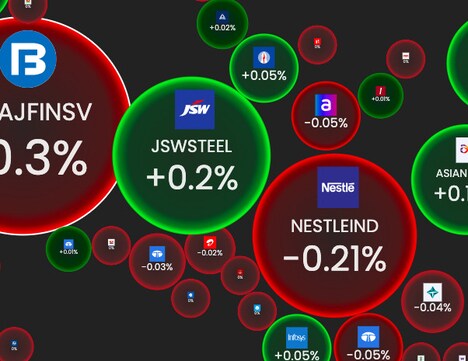
The color-coordinated bubbles indicate categories titled earning, fighting (war), giving (donations) and hustling (corporate) and more. The bubbles vary in size, visually representing the sum of money associated with each. Viewers can easily visualize the mind-boggling amount of money that was devoted to tax havens, debt and financial crises.
Why This Trend Is Growing
- Interactive Infographics
- There is a growing trend of creating interactive infographics that allow for a more engaging and informative user experience.
- Generative Code
- The use of generative code in infographics is a disruptive innovation opportunity that can streamline the creation process and enable interactive functionality.
- Visualizing Budget Data
- The trend of visually representing complex budget data through interactive infographics provides a clearer understanding of financial information.
Industries Being Reshaped
- Marketing and Advertising
- The marketing and advertising industry can leverage interactive infographics to create more compelling and interactive campaigns for their clients.
- Data Visualization
- The data visualization industry can benefit from using generative code to produce visually appealing and informative representations of complex datasets.
- Financial Services
- The financial services industry can utilize interactive infographics to help clients understand complex financial information and make more informed decisions.