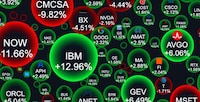
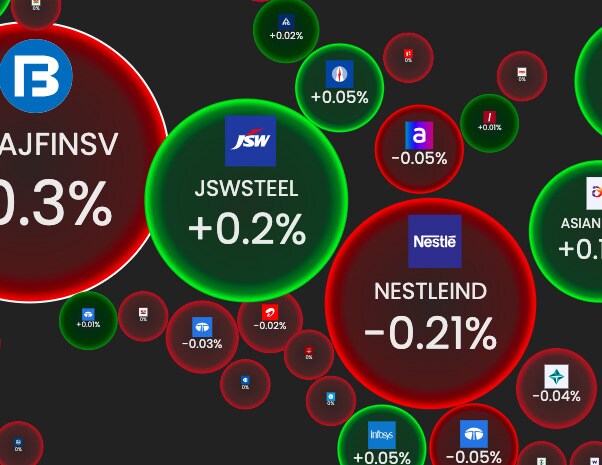
Stockbubbles is a data visualization tool that is designed for analyzing the Indian stock market in a unique way. Its interactive bubble chart provides a visually intuitive way to track stock market trends, including price movements and trading volume.
This tool allows users to better understand market dynamics and identify patterns that may not be immediately obvious from traditional data. Stockbubbles can be valuable for both new and experienced investors looking to gain deeper insights into stock performance and make more informed decisions. With its dynamic charts and user-friendly interface, Stockbubbles offers a fresh approach to market analysis, making it easier for investors to interpret complex financial data and stay ahead in a competitive market.
Image Credit: Stockbubbles
What's Driving This Trend
- Interactive Data Visualization
- Innovative tools like interactive bubble charts transform traditional stock analysis into a more intuitive and engaging experience.
- User-centric Financial Tools
- By prioritizing user-friendly interfaces, financial technologies enhance accessibility and understanding for a wider range of investors.
- Real-time Market Analysis
- Dynamic and real-time data visualization methods offer investors an edge in analyzing current market trends and making timely decisions.
Who This Affects Most
- Fintech
- The integration of advanced data visualization techniques is revolutionizing the fintech sector, attracting both novice and seasoned investors.
- Big Data Analytics
- Incorporating visual-driven analytics into stock market tools exemplifies the growing influence of big data in financial decision-making.
- Investment Platforms
- Investment platforms are embracing innovative tools to provide users with deeper market insights and competitive advantages.