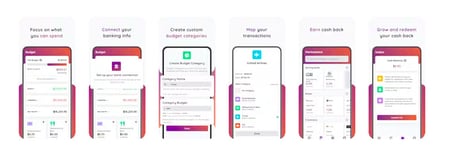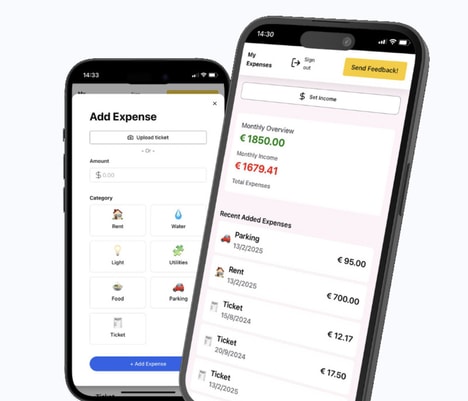
Budget Visual is a free app designed to help users better understand their financial activity through visualizations. By connecting to credit card or bank statements, the app categorizes transactions, tracks spending over time, and allows users to filter by time frames or expense types.
These insights aim to provide a clearer picture of personal finances, enabling users to identify patterns, optimize spending, and make informed budgeting decisions. The platform emphasizes simplicity and accessibility, offering an intuitive interface that visualizes data without requiring advanced financial knowledge. From a business perspective, Budget Visual illustrates the growing trend of fintech solutions leveraging visualization tools to improve user engagement and financial literacy, supporting informed decision-making and empowering individuals to manage their money more effectively.
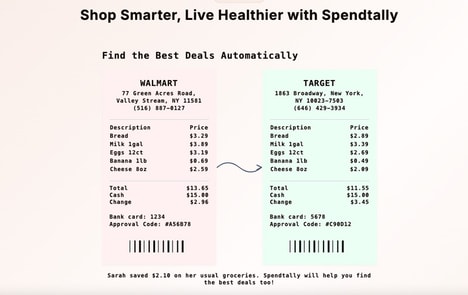
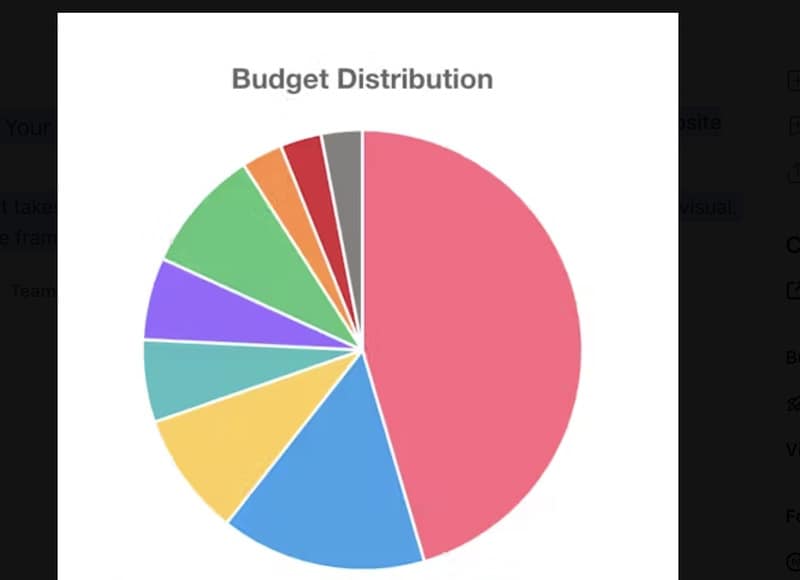
Image Credit: Budget Visual
Why This Trend Is Growing
- Data-driven Budgeting
- Harnessing visual data to personalize budgeting offers insights that allow users to tailor financial strategies uniquely suited to their spending habits.
- Fintech User Engagement
- Incorporating visualization tools within fintech platforms enhances user engagement by presenting complex financial data in an easily digestible format.
- Financial Literacy Enhancement
- Improving financial literacy through visual aids empowers users to make educated decisions without requiring advanced expertise in finance.
Industries Being Reshaped
- Fintech
- The fintech industry benefits from apps like Budget Visual that simplify personal finance management through intuitive visual tools.
- Personal Finance Management
- Personal finance management sees growth as apps use visualizations to help users comprehend and control their spending patterns.
- Data Visualization
- Data visualization becomes crucial in financial services as it translates complex financial information into user-friendly formats for everyday users.