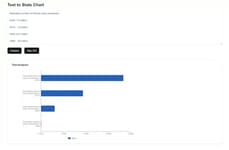


The Twitter Statistics Visualization Graphically Illustrates Our Twitter
Katherinev123 — September 30, 2009 — Pop Culture
References: digitalbuzzblog
As if we didn’t already know how Twitter has (almost) taken over the world, a designer who goes by the name ‘David’ has created this Twitter Statistics Visualization system.
Displaying in a graphics format how people use Twitter and our perceptions of the social media engine, the Twitter Statistics Visualization system shows skews between men and women as well as the percentage of “spammers, robots, loud mouths, content creators, quitters and more,” according to DigitalBuzzBlog.org. Now we don’t have to contemplate Twitter’s ubiquitous hold on our status-updating lives—we can actually see it unfolding!
Displaying in a graphics format how people use Twitter and our perceptions of the social media engine, the Twitter Statistics Visualization system shows skews between men and women as well as the percentage of “spammers, robots, loud mouths, content creators, quitters and more,” according to DigitalBuzzBlog.org. Now we don’t have to contemplate Twitter’s ubiquitous hold on our status-updating lives—we can actually see it unfolding!
Trend Themes
-
Data Visualization — Opportunity for innovative data visualization tools that can present complex Twitter statistics in an accessible and intuitive way.
-
Social Media Analytics — Potential for advanced analytics platforms that can analyze and interpret Twitter data to provide actionable insights for businesses and marketers.
-
Gender Analysis — Emerging field of gender analysis in social media, offering opportunities to explore and understand gender-based differences in Twitter usage.
Industry Implications
-
Data Visualization — Opportunity for data visualization companies to create visually appealing and interactive graphics that can represent Twitter statistics in a meaningful way.
-
Social Media Marketing — Growing demand for social media marketing agencies and consultants who can leverage Twitter statistics to optimize marketing strategies and campaigns.
-
Market Research — Increasing need for market research firms to incorporate Twitter data analysis into their methodologies to gain deeper insights into consumer behavior and trends.
4.8
Score
Popularity
Activity
Freshness