CNET News.com has introduced a visual tool THE BIG PICTURE for news search. Here's straight from the source:
The Big Picture is a CNET News.com special feature. It creates visual maps that show relationships between stories, companies, and topics within the News.com site.
*How it works* For every story published, News.com editors and reporters included relevant links to other News.com stories. In addition, News.com highlights the important companies that appear in a story as well as attach appropriate topics to each story.
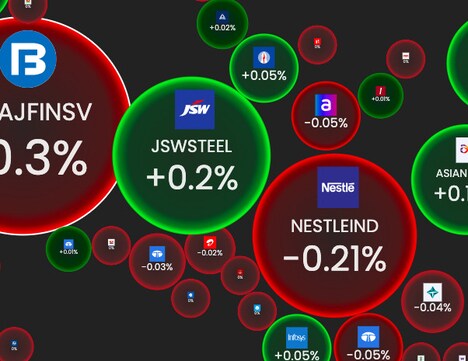
Each story has a visual map which shows related stories, topics, or news from the same company. Stories on the map are represented with "bubbles" - the more popular a story, the larger the bubble.
It's an interesting feature - and a vast improvement over the textual tag cloud which is currently a popular method of displaying data by importance. Tag clouds, however, miss the "relationship" element and don't show how stories connect to one another - which is the beauty of THE BIG PICTURE tool.
I have loved it!
What's Driving This Trend
- Visual News Search
- Creating visual maps for news search to show relationships between stories, companies, and topics within a site presents an opportunity for companies to differentiate and enhance the user experience.
- Story Relationship Mapping
- Introducing visual maps that show how news stories connect to one another presents an opportunity for companies to add value to their content and distinguish their brand from competitors.
- Data Visualization
- Developing alternative methods to displaying data by importance, such as the use of visual maps, presents an opportunity for companies to provide a more engaging and informative experience for users.
Who This Affects Most
- News and Media
- News and media companies can leverage visual mapping tools to differentiate their content and provide a more engaging and informative experience for users.
- Technology
- Technology companies can innovate their search tools by developing visual mapping software to show relationships between topics and companies on their sites.
- Data Analytics
- Data analytics companies can provide value by developing tools that create visual maps to display data relationships in a more meaningful and comprehensible format.