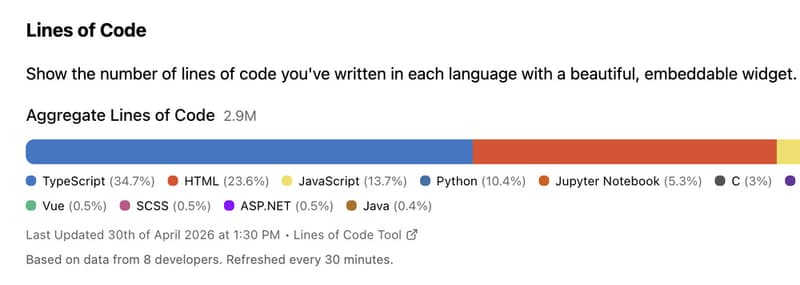
Lines of Code enters the developer analytics space with a focus on quantifying coding output across GitHub repositories. By aggregating line counts across programming languages, it offers a simplified metric for visualizing developer activity. From a business perspective, it aligns with the growing interest in personal developer branding and transparent contribution tracking, particularly within open-source ecosystems.
The tool’s emphasis on an interactive, embeddable graph suggests use cases in portfolios, resumes, and team dashboards where visual representation of output is valued. While line count is a widely debated productivity metric, the platform reflects ongoing demand for lightweight, accessible indicators of coding activity. Its relevance will likely depend on how users interpret and contextualize the data, as well as whether it evolves beyond surface-level metrics into deeper insights about code quality or project complexity.
Image Credit: Lines Of Code
What's Driving This Trend
- Visual Developer Branding
- Interactive contribution graphs are positioned to reshape personal portfolios and public profiles by making coding output visually salable and comparable.
- Lightweight Productivity Metrics
- Simple line-count indicators are emerging as accessible proxies for activity that could displace heavier analytics when teams prioritize speed and visibility over complexity.
- Embeddable Interactive Analytics
- Embeddable visualizations are trending toward becoming standard components in resumes, project pages, and team dashboards, enabling contextualized snapshots of developer activity.
Who This Affects Most
- Recruiting and HR Tech
- Hiring platforms could integrate contribution visualizations to produce new candidate signals that influence screening and talent discovery.
- Developer Tools and Platforms
- Code hosting and IDE vendors may expand into value-added analytics that combine count-based metrics with deeper quality and complexity measurements.
- Open-source Ecosystem Services
- Services around contributor reputation and monetization may arise from normalized, transparent contribution data that supports sponsorship and stewardship models.