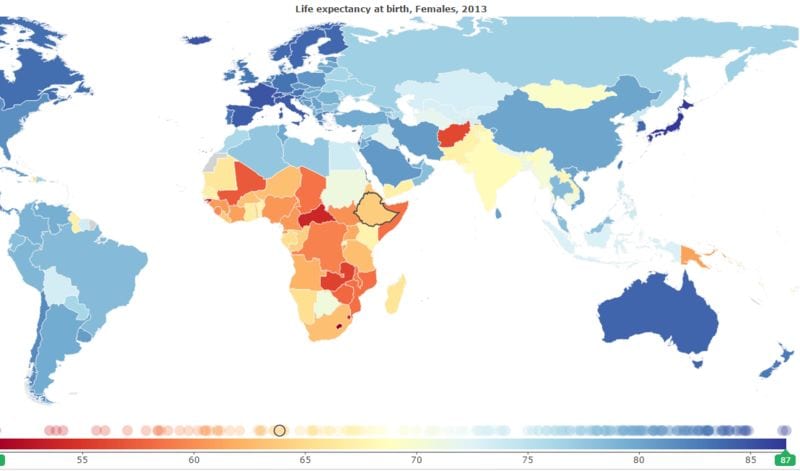
The University of Washington has created a detailed map appropriately dubbed Health Metrics and Evaluation. It visualizes the life expectancy and probability of death between 1990 and 2013 in 188 countries. Specifically, it explores how these metrics have changed over the years by taking into account different health issues and more.
From the Health Metrics and Evaluation, people will readily find out that Japan and Iceland have some of the highest life expectancy rates while Central Africa Region has some of the lowest. Completely interactive, people will be able to zoom in and out of the color-coded map in a way that is entirely user-friendly. It's interesting to see big data displayed in such a convenient way, shedding light of life span around the world.
What Makes This Trend Stand Out
- Global Health Data Visualization
- Opportunity for data visualization companies to provide tools that can help researchers to more easily understand and interpret complex health data.
- Interactive Data Display
- Companies should look into creating interactive data displays to present information in a user-friendly way, like Health Metrics and Evaluation's color-coded map.
- Longevity Analysis
- Opportunity to develop platforms that use data analysis to track and predict changes in life expectancy around the world.
Sectors Adopting This
- Healthcare
- Hospitals and health systems could use data visualization tools to analyze health trends, improve patient outcomes, and streamline operations.
- Technology
- Tech companies can develop more advanced tools for data collection, analysis and display, particularly related to big data in the healthcare sector.
- Insurance
- With information gathered from these interactive visualizations, insurance companies can underwrite policies with more accuracy and better assess risk.