Roadway.report is an online data visualization platform that provides insights into traffic-related fatalities in the United States from 2001 to 2022. The platform aggregates publicly available data on traffic deaths and presents it in a visual, interactive format, enabling users to explore trends over time and across different states or regions.
By visualizing the data, Roadway.report allows policymakers, researchers, and the public to identify patterns, assess the impact of traffic safety measures, and understand regional disparities. The tool focuses on clarity and accessibility, providing charts and maps that simplify complex datasets. While the data is historical, the platform offers a foundation for analysis that can inform decisions in urban planning, transportation policy, and safety initiatives, highlighting areas where interventions may be most needed.
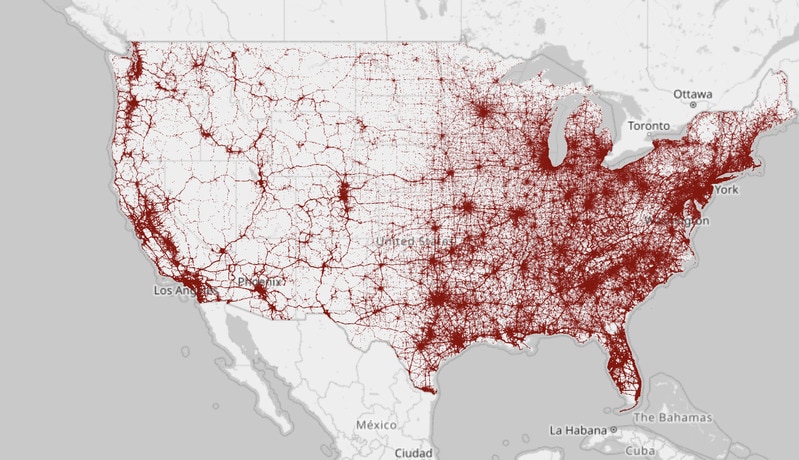
Image Credit: Roadway.report
What's Driving This Trend
- Data-driven Safety Initiatives
- Comprehensive visualizations of traffic fatalities can drive innovations in safety strategies by providing clearer insights into high-risk areas.
- Interactive Public Policy Tools
- Interactive platforms that present complex data visually are transforming how policymakers engage with and respond to critical public safety issues.
- Regional Disparity Analysis
- Analyzing traffic fatality data across states reveals inequities, prompting targeted interventions and tailored safety programs.
Who This Affects Most
- Urban Planning Software
- Platforms like Roadway.report can revolutionize urban planning by integrating clear visual insights into historical traffic data.
- Transportation Policy Consultancy
- Consultancies can leverage data visualizations to craft more effective transportation policies that address identified risks and trends.
- Smart City Solutions
- Smart city initiatives benefit from data-driven tools that facilitate proactive measures in improving overall traffic safety.