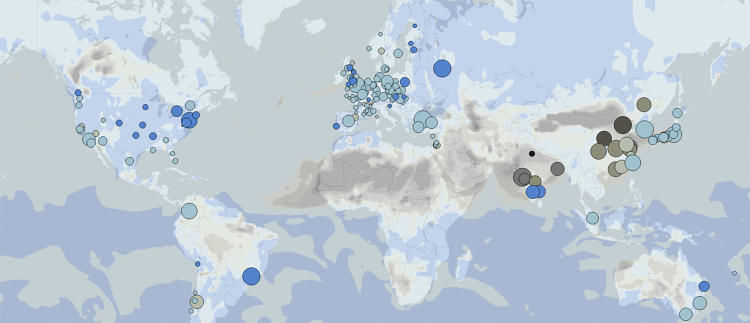
The Paris-based organization 'Plume Labs' recently debuted a digital map that displays current pollution levels in cities all over the world. As scientific research continues to show, smog is a problem faced by the majority of the world's cities. This map provides a visual way to conceptualize the problem by using real-time data.
The 'Worldwide Air Map' is a digital map that reveals current pollution levels all over the world. The map features small blue bubbles that mark how clean the air is in each city. The darker the bubble appears, the more polluted the air is. The map continuously updates according to open data gathered from air quality monitors located in 40 different countries around the world. As the CEO and founder of Plume Labs Romain Lacombe explains, the map "reveals the invisible by visualizing the pollution in the air we breathe, live and all around the world, rather than city by city."
The map ultimately serves as a global reminder that air pollution is a global issue that requires a collective effort from citizens in every country.
Key Themes Behind This Trend
- Real-time Pollution Maps
- Real-time maps that display pollution levels in each city provide an opportunity for innovation in air quality monitoring and regulation.
- Open Data
- The use of open data to create real-time pollution maps provides opportunities for innovation in data analysis and visualization.
- Global Environmental Awareness
- Real-time pollution maps can contribute to global environmental awareness, providing opportunities for innovation in education and advocacy.
Where This Applies
- Environmental Monitoring and Regulation
- Real-time pollution maps can be integrated into environmental monitoring and regulation systems, providing opportunities for innovation in pollution control and reduction.
- Data Science and Visualization
- The use of open data to create real-time pollution maps provides opportunities for innovation in data analysis and visualization.
- Education and Advocacy
- Real-time pollution maps can be used in educational and advocacy initiatives to raise global environmental awareness and promote sustainable practices and policies.